Nine of the top ten warmest years in the modern meteorological record have occurred since the year 2000. Last year was another one of them, coming in at 9th warmest since 1880.
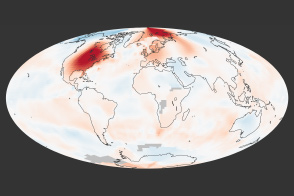
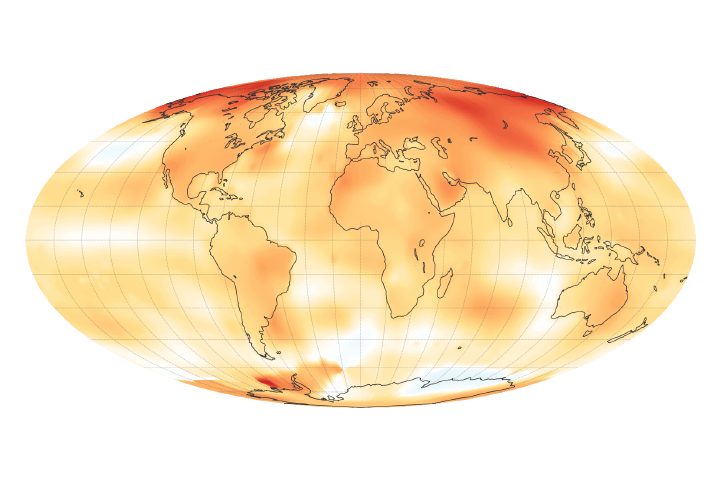
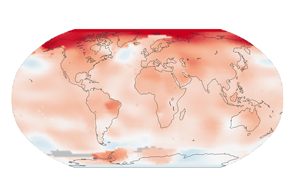
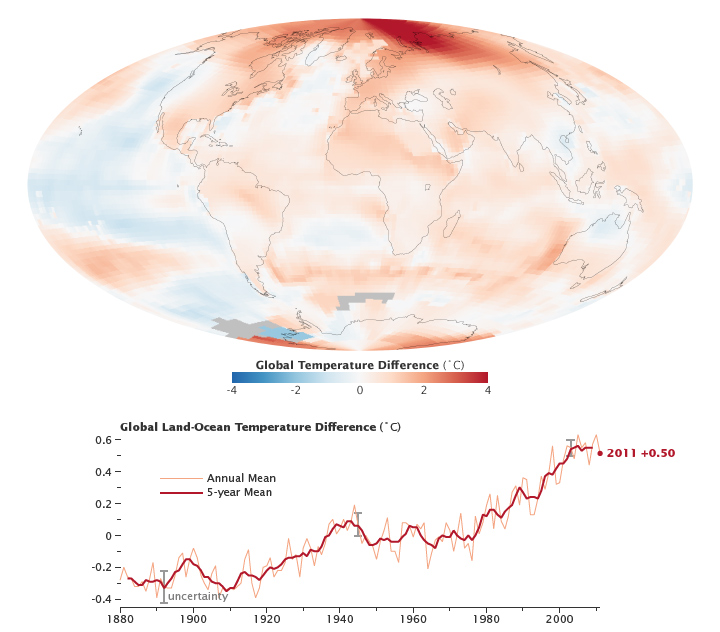
The map above shows temperature anomalies, or changes, by region in 2011; it does not depict absolute temperature. Essentially, the map shows how much warmer or cooler each region was in 2011 compared with an averaged “base period” from 1951–1980. The line plot shows yearly temperature variations (from the base period average) for every year from 1880 to now. (For more explanation of how the analysis works, read World of Change: Global Temperatures.)
On January 19, 2012, researchers at NASA’s Goddard Institute for Space Studies (GISS) released their annual analysis of global temperatures, noting that Earth’s land and ocean surfaces continue to experience higher temperatures than several decades ago. The global average temperature for 2011 was 0.92 degrees Fahrenheit (0.51 Celsius) higher than the mid-20th century baseline.
“We know the planet is absorbing more energy than it is emitting,” said GISS director James Hansen. “So we are continuing to see a trend toward higher temperatures. Even with the cooling effects of a strong La Niña influence and low solar activity for the past several years, 2011 was one of the ten warmest years on record.”
The difference between 2011 and the warmest year (2010) is 0.22 degrees F (0.12 C). This underscores why scientists emphasize long-term trends, as opposed to year-to-year variations. Because of the large natural variability of climate, scientists do not expect annual temperatures to rise consistently each year. However, they do expect a continuing rise over decades.
Higher temperatures today are largely sustained by increased concentrations of atmospheric greenhouse gases, especially carbon dioxide. These gases absorb the infrared radiation emitted by Earth and release it into the atmosphere, rather than allowing it to escape to space. As the concentration of greenhouse gases in the atmosphere has increased, the amount of energy “trapped” by these gases has led to higher temperatures. The carbon dioxide level was about 285 parts per million in 1880, when the GISS global temperature record begins. By 1960, the average concentration had risen to 315 parts per million. Today it exceeds 390 parts per million and continues to rise.
Hansen said he expects record-breaking global average temperature in the next two to three years because solar activity is on the upswing and the next El Niño will increase tropical Pacific temperatures. “It’s always dangerous to make predictions about El Niño, but it’s safe to say we’ll see one in the next three years,” Hansen said. “It won’t take a very strong El Niño to push temperatures above 2010.”
NASA images by Jesse Allen, Robert Schmunk, and Robert Simmon, based on data from the Goddard Institue for Space Studies. Caption by Patrick Lynch and Michael Carlowicz, based on reporting by Patrick Lynch.