
Except for the edges, Greenland is buried in ice year round. Each winter, snowfall covers even the margin, leaving the entire island white. Each summer, the snow melts, exposing the rocky coastline, where glaciers pour out to sea through narrow fjords. In the past decade or so, the seasonal thaw has grown more dramatic. Meltwater runs in streams that plunge deep into the ice. Ice-dammed lakes collapse under their own weight and pour water into the sea.
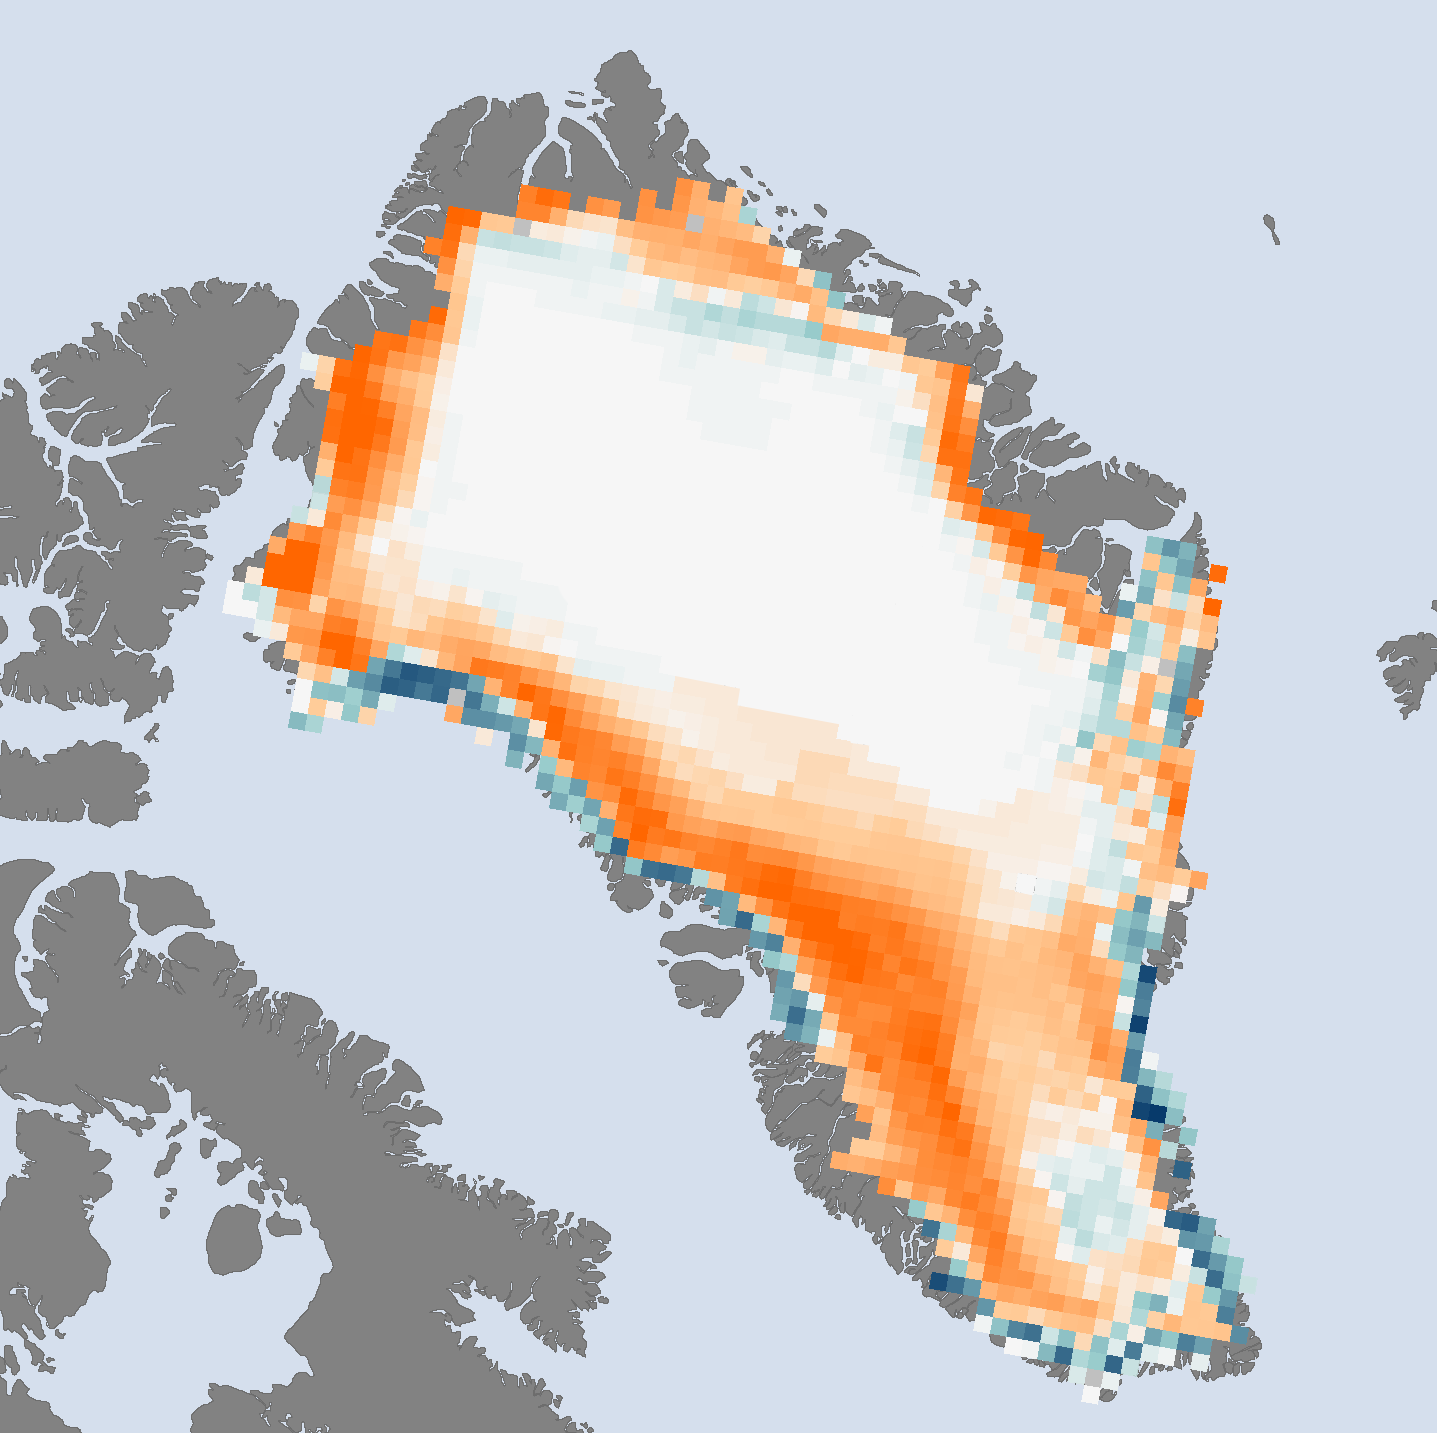
According to NOAA’s 2011 Arctic Report Card, the surface melt on the Greenland Ice Sheet in summer 2011 did not break the record set last summer, but it was still above the long-term average. The map above shows where surface melt was detected by satellites on more (orange) or fewer (blue) days than the 1979–2010 average. White indicates no difference from average or changes too small to be detected by the satellite.
Depending on the data analysis approach, 2011 was either the third most extensive or the sixth most extensive melting year since satellite records began in 1979. Melting was exceptionally high over the western mid-elevations, and the map shows the area swathed in orange. In some places, the melt season lasted up to 30 days longer than average (the top of the scale corresponds to anomalies 25 days or more), and it affected 31 percent of the ice sheet surface, making 2011 one of just three years since 1979 where melt area exceeded 30 percent.
Given the large fraction of the high elevations of the ice sheet that experienced more melting than average, the blue fringe of “less melting” along the southern and western coasts might seem puzzling. How could the lower elevations of the ice sheet be melting less than average if the higher elevations are melting more than average?
According to remote sensing scientist and Arctic Report Card author Marco Tedesco, this ribbon corresponds to places where the snow now retreats so completely in the summer that the ice surface is bare. The bare surface “blinds” the satellite to the presence of melt water; it is much easier for the satellite to detect liquid water when the surrounding terrain is snow-covered.
Because recent years are more likely to have bare ice than the earliest years in the time series, the analysis seems to show that melting has decreased at the ice margin. Scientists know from field observations, however, that this outermost edge is melting, too. Year after year, surface melting, combined with the collapse of ice shelves and the increasingly rapid flow of Greenland glaciers, is contributing to sea level rise. According to the Arctic Report Card, ice mass loss from Greenland in 2011 was about 430 gigatons—enough ice to raise global sea level by just over 1 millimeter.
Image and caption courtesy NOAA’s Climate.gov Website.