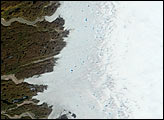
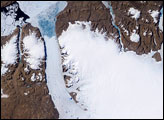
Greenland is the world’s largest island, containing the second largest ice sheet on Earth, with a surface extent of approximately 1.75 million square kilometers and an average thickness of 2.3 kilometers (1.6 miles). Greenland’s ice sheet is the Northern Hemisphere’s largest remaining relic of the last ice age. The ice sheet is so massive it holds about 7 percent of all freshwater on Earth, enough water to elevate global sea level by 5 meters (16 feet) if it melted completely. Scientists estimate it would take several centuries of global warming to melt all the ice on Greenland. Although scientists are not forecasting a disastrous sudden loss of Greenland’s ice, they do observe considerable melting around the fringes of the sheet. This melting is only partly offset by the observed increase in the ice sheet’s thickness within the island’s highland interior. A 2006 study revealed that Greenland’s ice mass decreased about 101 billion tons per year from 2003-2005 (see Greenland Ice Sheet Losing Mass).
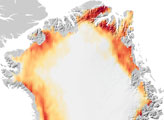
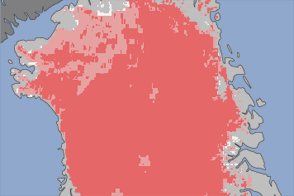
Will this trend continue? Today, thanks to modern satellite technology, the quickest and easiest way for scientists to survey the polar regions on a daily basis is from the unique vantage point of space. The image above was made using data collected by the Defense Meteorological Satellites Program (DMSP-F13) Special Sensor Microwave/Imager (SSM/I) from April 1 to September 1, 2006. It shows the number of days snow was melting during that 5-month period. The SSM/I sensor measures microwave radiation emitted naturally from Earth’s surface. Dry snow and liquid water behave differently in the microwave region of the spectrum, a fact that allows scientists to distinguish melting snow from dry snow with SSM/I data.
Marco Tedesco, a scientist at NASA’s Goddard Space Flight Center, was able to determine the number of days on which there was melting on the surface of Greenland’s ice sheet by comparing SSM/I measurements taken both during the day and at night through most of the spring and summer of 2006. Specifically, by taking a difference of those measurements at frequencies of 19.35 gigahertz and 37 gigahertz each day, Tedesco was able to use the SSM/I data to map where melt water occurred—even melt water below the surface. Darker blue shades show where there were more days of melting (up to 60 days or more), and lighter blue shades show fewer melting days (down to zero). The topographic shading along the coastlines is based on data collected by NASA’s ICESat satellite.
Such data are particularly relevant now that the Fourth International Polar Year (IPY) is underway. March 1, 2007, marked the beginning of the IPY. The IPY actually spans two full years (March 2007 through March 2009) and includes more than 200 science research projects involving more than 10,000 scientists from 63 nations. The goal of IPY is to increase international cooperation in polar exploration while advancing scientific understanding of these regions. One objective is to observe and measure the ways in which the polar regions affect, and are affected by, the global climate system. NASA is participating in the IPY Program, and Greenland is a major focal point of its research effort.
Image by Robert Simmon, NASA’s Earth Observatory, using data and analysis courtesy Marco Tedesco, University of Maryland-Baltimore County.