The 2006-2007 rainy season in the Horn of Africa brought devastating floods throughout much of the region. Heavy rains began in late October and continued into January, at times allowing inundated areas only a few days to dry out before being hit again with heavy rain and flooding. Ethiopia, Somalia, and Kenya were the hardest hit countries in the region, but neighboring countries have also had to deal with localized flooding problems. The flooding in Kenya was very widespread, affecting most of the country.
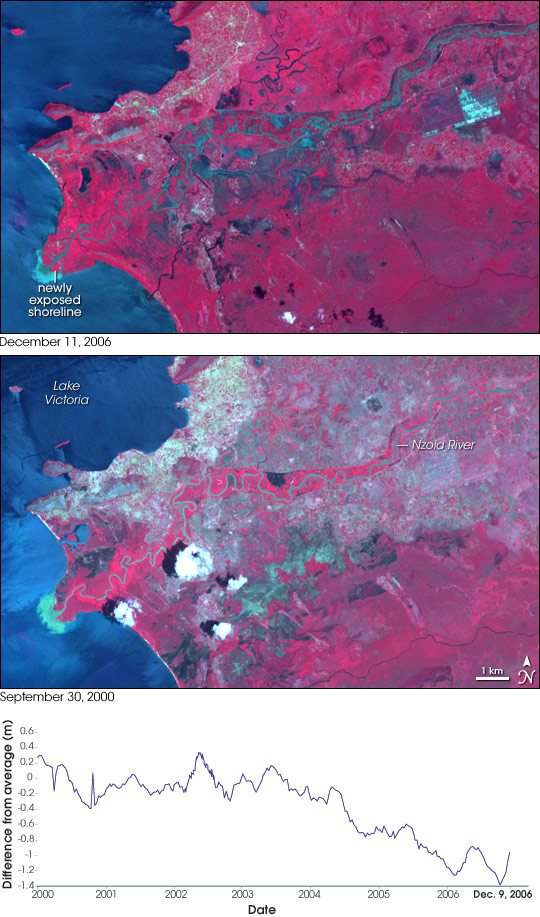
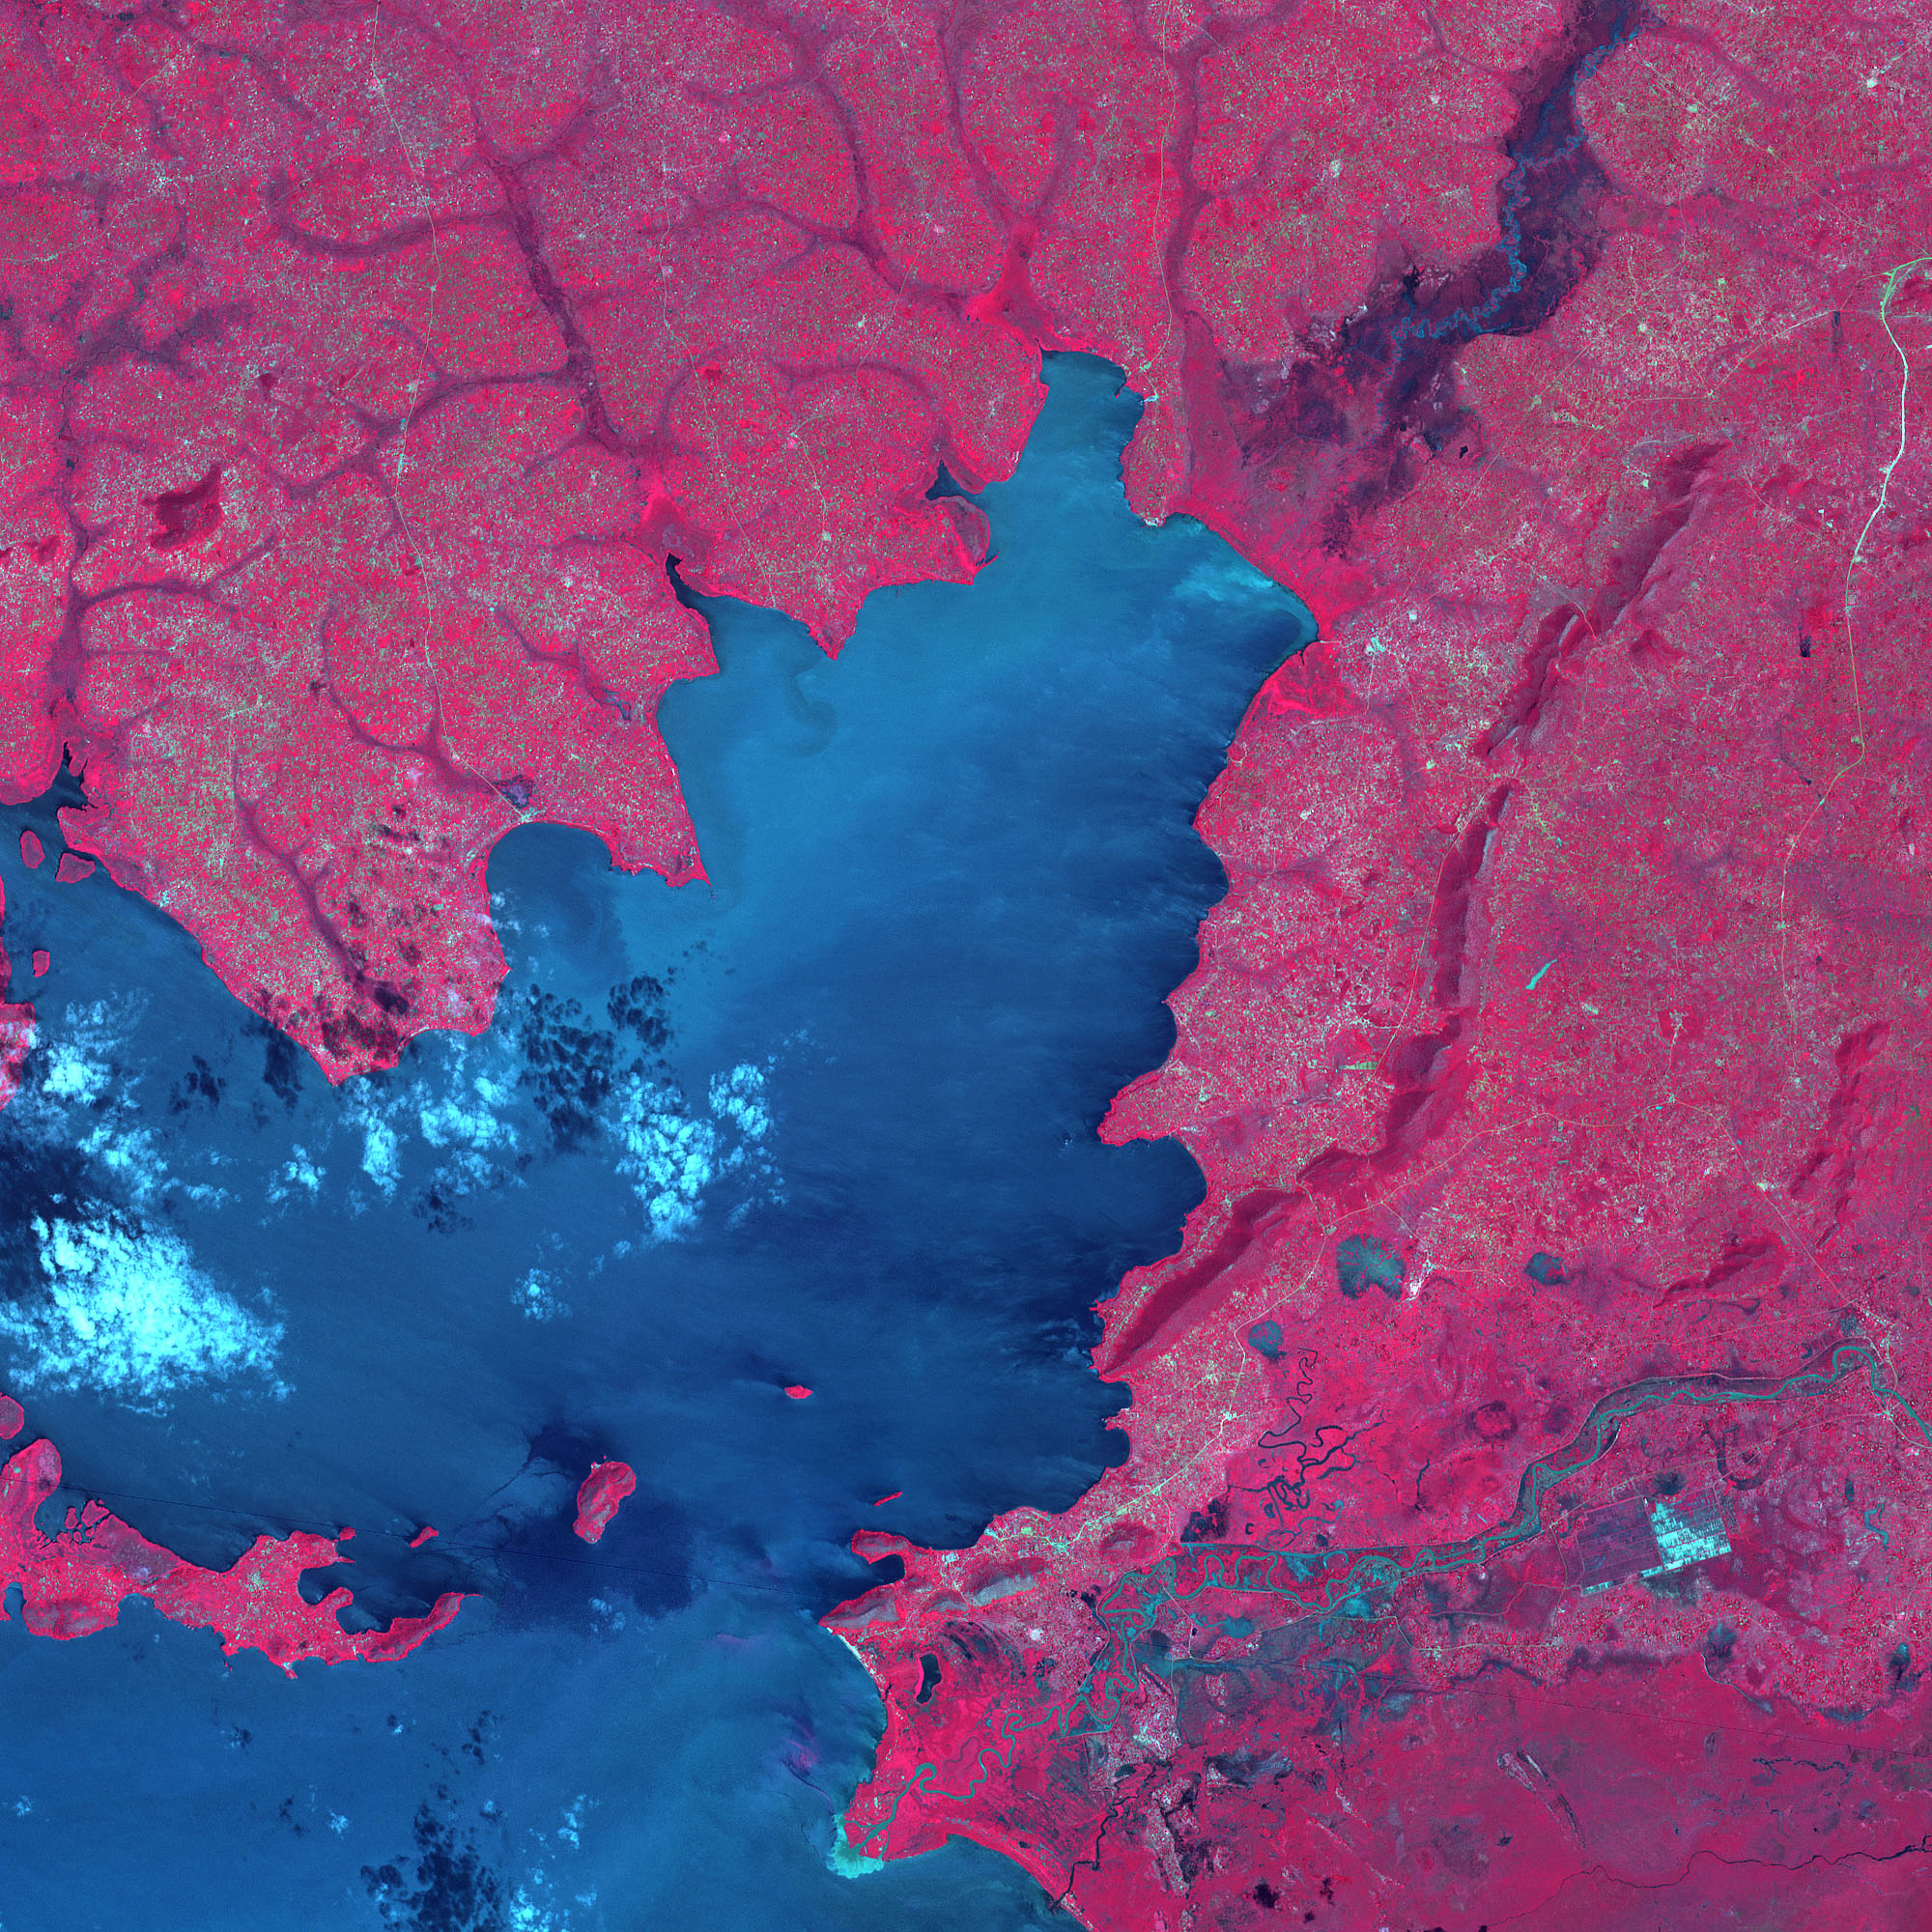
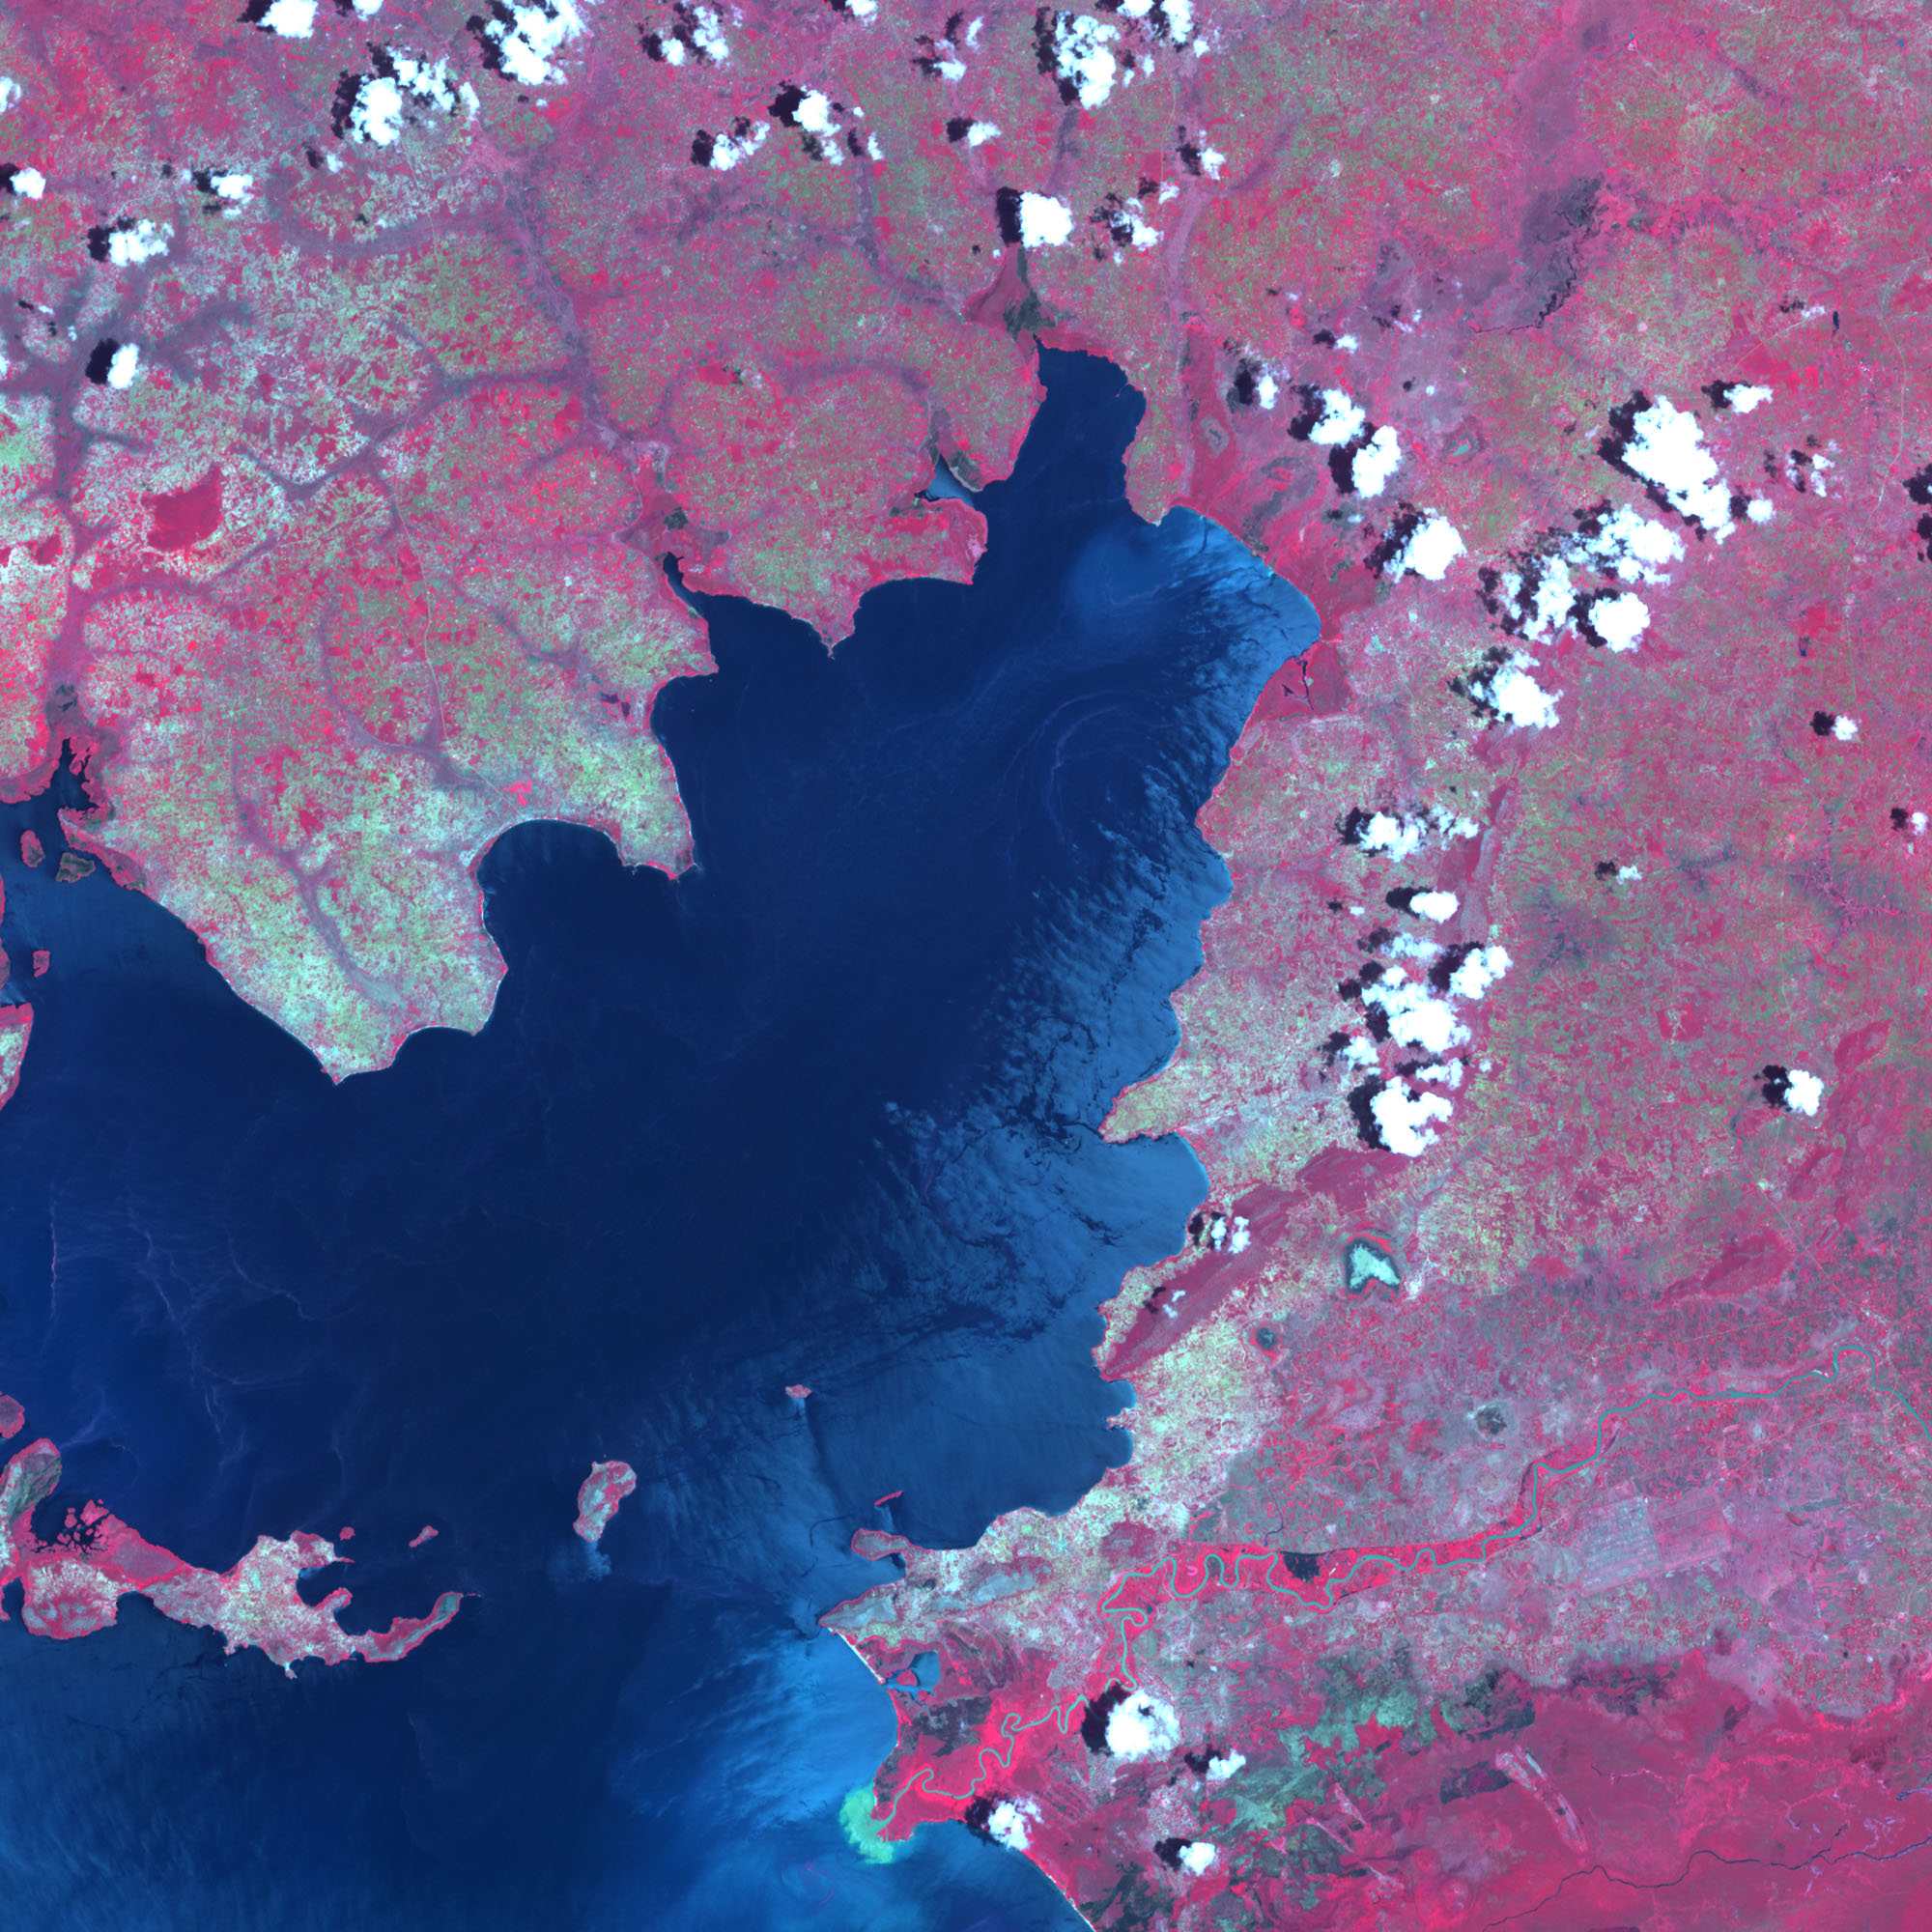
In western Kenya, near Lake Victoria, the Budalangi division of Busia District was severely affected by flooding as dikes burst along the Nzoia river. The flooding was evident on December 11, 2006, when the Advanced Spaceborne Thermal Emission and Reflection Radiometer (ASTER) on NASA’s Terra satellite captured the top image. The lower, pre-flood scene was acquired on September 30, 2000, when the river was at normal levels. Natural vegetation appears red in these false-color ASTER images, which are made from the sensor’s observations of visible and infrared light. In the flood image, pale blue water inundates large areas of commercial cropland, the large rectangle on the right, and settled areas, which are pale grey in the lower image. People who were displaced by the floods along the Nzoia were relocated to temporary camps. Cropland along the river was flooded and irrigation infrastructure was destroyed.
Beyond the immediate effects of the flooding, which included deaths and displacement of a large number of people, as well as damage and destruction of property and critical infrastructure, the floods were expected to impact long-term food security and lead to outbreaks of disease. Some of these fears were realized in late December and January, when the standing water caused a resurgence of Rift Valley Fever in eastern Kenya. The disease is most frequently spread by mosquitoes, which proliferate in standing water, says the Centers for Disease Control.
In addition to causing floods throughout Kenya, the rains have raised the water level on Lake Victoria. The lower chart tracks the variation in water levels on Lake Victoria as recorded by the Jason-1 satellite from January 7, 2000, to December 9, 2006. The chart shows deviation from the average water level recorded by Jason and its predecessor, TOPEX/POSEIDON, over a 10-year period. Since 2000, the water level on Lake Victoria has been dropping. Rainy seasons are recorded in the seasonal upswing of the line, but the overall trend is down as drought and water use have steadily drawn water from the lake. The effect of the drop in water level between 2000 and 2006 is visible in the ASTER images. The shoreline changed shape as water levels on Lake Victoria dropped. Most notably, the Nzoia River has a larger delta in the 2006 image, despite the floods, and the shore north of the delta extends farther into the lake.
Though the long-term trend in water level on Lake Victoria is down, as the rains started at the end of 2006, the line curved steeply up reflecting a dramatic increase in the water level. The intensity of the rains caused the water level on the lake to rise by half a meter between October 21 and December 9, 2006. Even with this increase, the water level is still well below average. It remains to be seen if the rains will reverse the long-term downward trend or if Lake Victoria will continue to shrink.
The 2006-2007 rainy season in the Horn of Africa brought devastating floods throughout much of the region. Heavy rains began in late October and continued into January, at times allowing inundated areas only a few days to dry out before being hit again with heavy rain and flooding. Ethiopia, Somalia, and Kenya were the hardest hit countries in the region, but neighboring countries have also had to deal with localized flooding problems. The flooding in Kenya was very widespread, affecting most of the country.
In western Kenya, near Lake Victoria, the Budalangi division of Busia District was severely affected by flooding as dikes burst along the Nzoia river. The flooding was evident on December 11, 2006, when the Advanced Spaceborne Thermal Emission and Reflection Radiometer (ASTER) on NASA’s Terra satellite captured the top image. The lower, pre-flood scene was acquired on September 30, 2000, when the river was at normal levels. Natural vegetation appears red in these false-color ASTER images, which are made from the sensor’s observations of visible and infrared light. In the flood image, pale blue water inundates large areas of commercial cropland, the large rectangle on the right, and settled areas, which are pale grey in the lower image. People who were displaced by the floods along the Nzoia were relocated to temporary camps. Cropland along the river was flooded and irrigation infrastructure was destroyed.
Beyond the immediate effects of the flooding, which included deaths and displacement of a large number of people, as well as damage and destruction of property and critical infrastructure, the floods were expected to impact long-term food security and lead to outbreaks of disease. Some of these fears were realized in late December and January, when the standing water caused a resurgence of Rift Valley Fever in eastern Kenya. The disease is most frequently spread by mosquitoes, which proliferate in standing water, says the Centers for Disease Control.
In addition to causing floods throughout Kenya, the rains have raised the water level on Lake Victoria. The lower chart tracks the variation in water levels on Lake Victoria as recorded by the Jason-1 satellite from January 7, 2000, to December 9, 2006. The chart shows deviation from the average water level recorded by Jason and its predecessor, TOPEX/POSEIDON, over a 10-year period. Since 2000, the water level on Lake Victoria has been dropping. Rainy seasons are recorded in the seasonal upswing of the line, but the overall trend is down as drought and water use have steadily drawn water from the lake. The effect of the drop in water level between 2000 and 2006 is visible in the ASTER images. The shoreline changed shape as water levels on Lake Victoria dropped. Most notably, the Nzoia River has a larger delta in the 2006 image, despite the floods, and the shore north of the delta extends farther into the lake.
Though the long-term trend in water level on Lake Victoria is down, as the rains started at the end of 2006, the line curved steeply up reflecting a dramatic increase in the water level. The intensity of the rains caused the water level on the lake to rise by half a meter between October 21 and December 9, 2006. Even with this increase, the water level is still well below average. It remains to be seen if the rains will reverse the long-term downward trend or if Lake Victoria will continue to shrink.
ASTER image by Jesse Allen using data provided by NASA, GSFC, METI, ERSDAC, JAROS, and U.S./Japan ASTER Science Team. Image and caption information from Jodie Smith, GIS Scientist, Early Warning and Environmental Monitoring, SAIC contractor to US Geological Survey Earth Resources Observation and Science, Sioux Falls, SD. JJason-1 data interpretation by Charon Birkett, University of Maryland, and Brian Beckley, SGT at NASA/GSFC. Lake level products courtesy of the USDA/FAS CropExplorer Program. The USDA/NASA/SGT/UMD team acknowledges the AVISO data center at CNES and the NASA Physical Oceanography DAAC for the provision of the TOPEX/POSEIDON and Jason altimetric datasets.

