Drive west through the northeast corner of Oregon on Interstate 84 on a summer’s day, and you drop out of the cool, pine-covered Blue Mountains onto a vast plain dotted with fields of potatoes, sweet peas, alfalfa, corn, and wheat. Green fields are interspersed with native tan-green sagebrush, antelope bitterbrush, native grasses, and the spiky golden heads of the invasive cheat grass. As the road angles northwest towards the Columbia River, the wide, heat-hazy view on the left side of the car is broken by stands of poplars, the tall, slender trees bending with a rustle of leaves in the wind gusting down the Columbia Gorge.
A popular commercial tree used as inexpensive lumber and pulp for paper, fast-growing poplars also guzzle a large amount of water, making them one of the most heavily irrigated crops in the Columbia River Basin. In nature, poplars grow in wetlands or along river banks, where they have access to water, and the poplar plantation is located close to the river for the same reason. Out the right window of the car, the view is vastly different. Native plants, low and desert-hardy, stretch across the flat plain leading to the river. This is the Umatilla Ordnance Depot. Suited to hot, dry summers and an average annual precipitation of 200 millimeters (eight inches), the native plants that grow on the depot use little water. While the contrast between the irrigated poplar plantation and the native plants may be impressive from the car window, it is even greater from space, and it is this difference in water use that differentiates the two ecosystems from space.
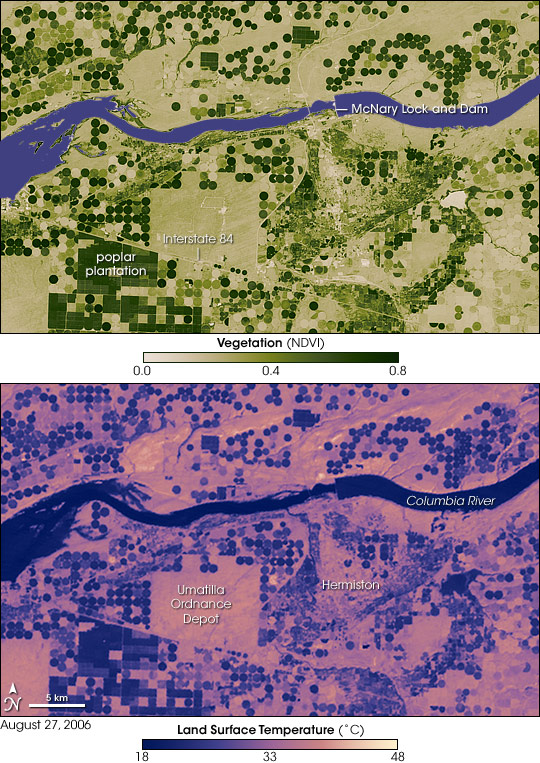
The difference between poplar plantations and native vegetation is illustrated in this pair of satellite images, collected by the Advanced Spaceborne Thermal Emission and Reflection Radiometer (ASTER) on NASA’s Terra satellite on August 27, 2006. The top image is a vegetation index image, which measures the density of plants on the ground based on the amount of photosynthesis recorded by the sensor. The vegetation index represents dense vegetation in dark green, while sparse vegetation is pale yellow. Crops watered with pivot irrigation systems form circles in varying shades of green, the shade determined by the density of the crop growing. Freshly harvested fields are a ghostly gold, barely detectable against the surrounding landscape. The native vegetation at the Umatilla Ordnance Depot is pale yellow, indicating sparse plants and shrubs with small leaves. The poplar plantation can be seen as dark green squares of dense vegetation south of the line cut across the image by Interstate 84. The difference between dark green, densely vegetated areas and pale, lightly vegetated areas is water. The regular patterns of green squares and circles indicate that these are irrigated areas. Native, non-irrigated vegetation, by contrast has an irregular shape.
The contrast between irrigated and non-irrigated land is even greater in the lower image, which shows land surface temperatures—how hot the land surface is to the touch. The coolest areas are dark blue, while the warmest areas are pink and yellow. As this image illustrates, irrigated crop lands are much cooler than the surrounding native vegetation. In this semi-arid region, the temperature difference between densely vegetated, irrigated land and lightly vegetated, non-irrigated land is as much as 30 degrees Celsius (54 degrees Fahrenheit), similar to the temperature difference between the Congo Rainforest and the Sahara Desert in Africa.
Thick, leafy plants cool the Earth’s surface through evaporation of water, while sparse, small-leafed plants cool the land less effectively. If a natural area is converted to irrigated agriculture, irrigated for a time, and finally abandoned, each of these changes has a dramatic and instantaneous impact on the flow of energy at the Earth’s surface—a key factor in weather, climate, and hydrological models. To read more about global land surface temperatures, see The Hottest Spot on Earth on the Earth Observatory.
NASA image created by Jesse Allen, Earth Observatory, using data provided courtesy of NASA/GSFC/METI/ERSDAC/JAROS, and the U.S./Japan ASTER Science Team.