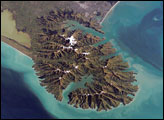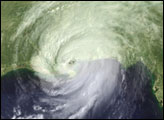
When Hurricane Katrina moved over the Gulf Coast of the United States on August 29, 2005, its effects were felt far from the reach of its powerful winds, drenching rains, and surging surf. The storm’s impact reverberated across the United States and the world, its tragedy still ringing fresh after a year. Though Katrina achieved the infamous distinction of being among the worst natural disasters in the United States, some good did come of the storm. Hurricane Katrina provided the perfect proving ground for the latest global atmospheric model developed at NASA Goddard Space Flight Center. The model was not designed to forecast weather, but it provides a picture of the processes that drive weather. By gaining a clearer understanding of the atmosphere, particularly as it relates to hurricanes, scientists can improve forecasts, and better forecasts can save lives.
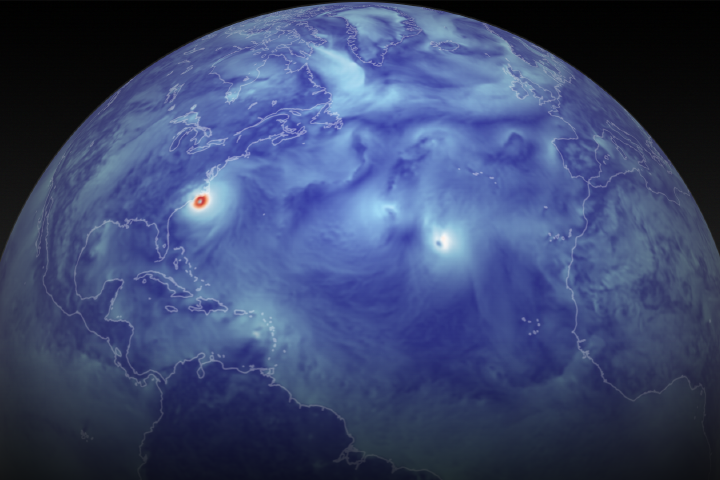
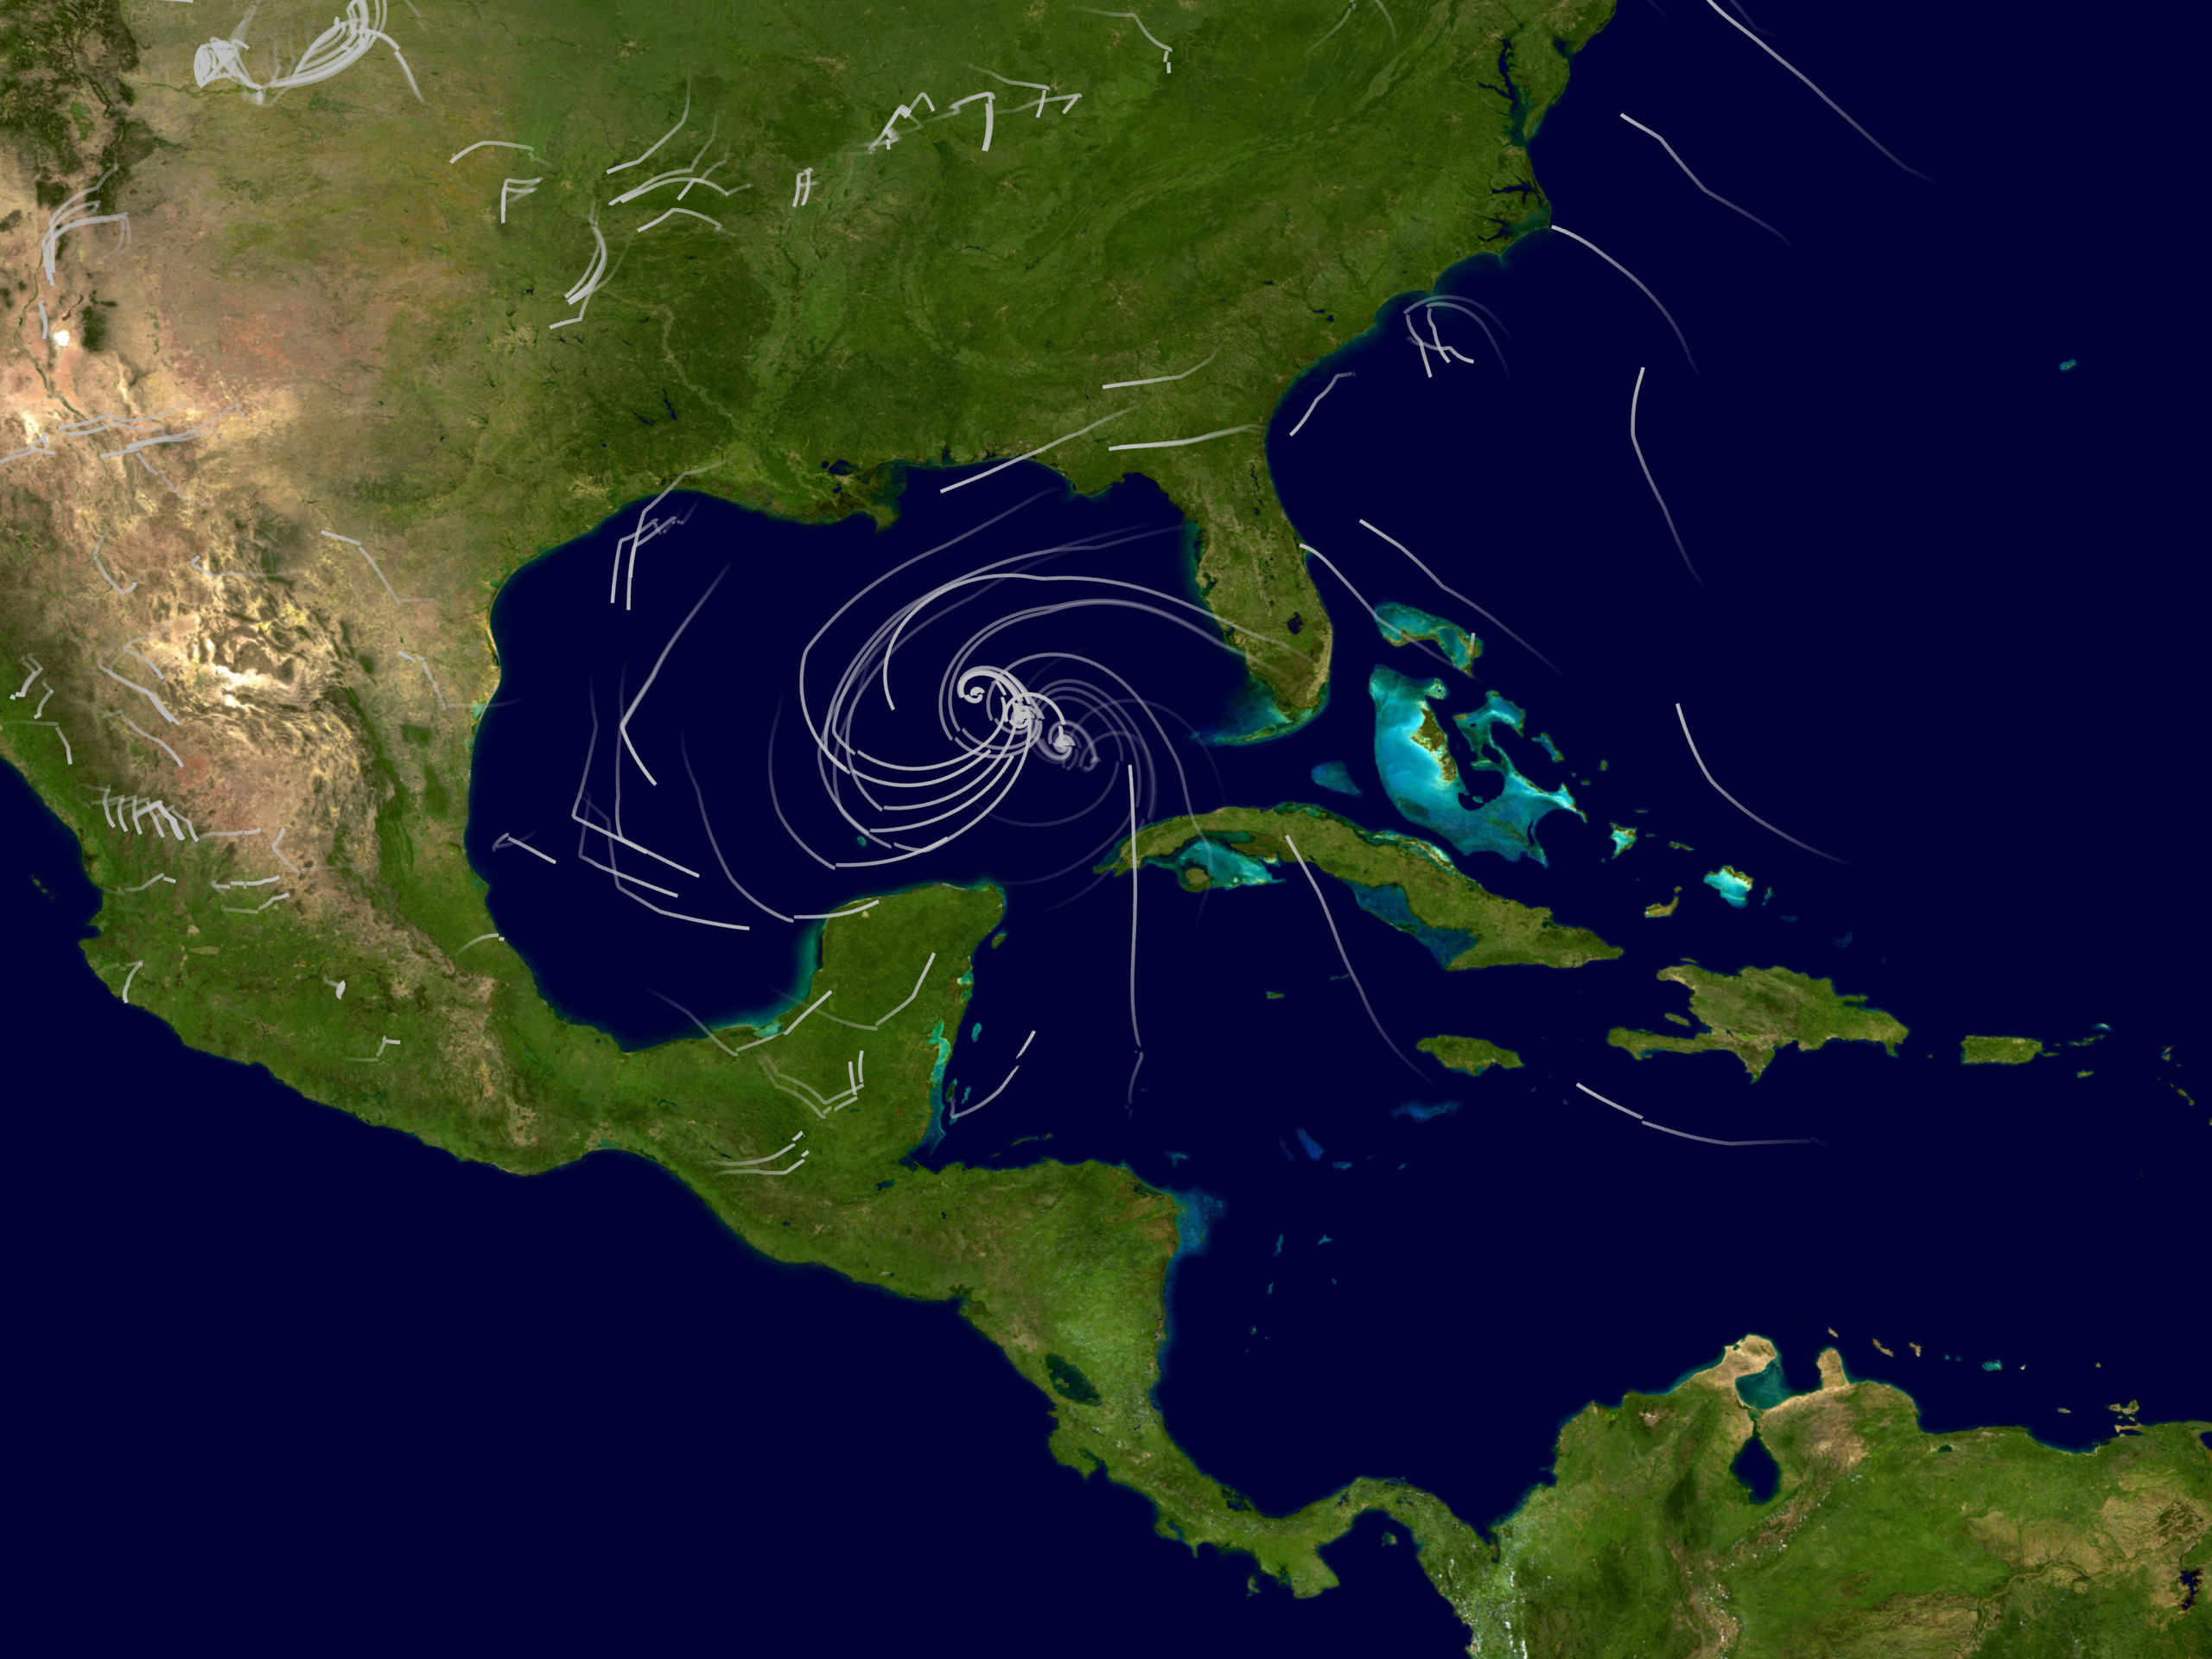
This image shows winds predicted by the model for August 28, 2005, the day Hurricane Katrina was at its strongest. White swirls near the center of the image illustrate the 161-mile-per-hour winds that circled through the storm on August 28. The lines resemble comets streaking through the sky, except that the lines are darkest at the head in the direction that the wind is moving. The length of the lines indicates how much the air had moved during a six-hour period. The concentrated dots that extend diagonally across the image show the eye of the storm moving steadily northwest towards the United States. The animation tracks Hurricane Katrina from August 23 to August 31, 2005. The predictions shown here closely matched the actual track the storm took.
The model that generated the wind predictions shown here is called GEOS-5 for Goddard Earth Observing System. It incorporates satellite data collected by NASA’s suite of Earth-observing satellites to describe how the atmosphere works. Basically, scientists want to know if temperatures, winds, and water vapor are this, then what will the atmosphere do? What underlying physical processes drive air circulation around the globe? More specifically, why do some storms turn into monstrous hurricanes, while others break apart into wisps of cloud? In many other scientific fields, such questions are answered in the lab, where scientists can make small tweaks to one thing to see how the whole system will react. But scientists studying the Earth have no such lab; they can’t adjust the flow of the wind to see how changes affect storm formation. Instead, they build a model, a mathematical description of the atmosphere in all of its complexities. If the model is accurate, then it can become the lab where scientists can change temperature or wind or humidity to see how each affects storm formation. In this way, scientists get a clear picture of how the atmosphere works.
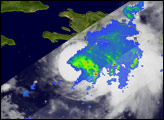
But the information the model provides is only as good as the model itself. To know how well GEOS-5 represented what the atmosphere would actually do, scientists at Goddard ran a simulation of the 2005 hurricane season. What better way to test the model than to see how well it represented one of the most powerful storms Nature is capable of producing? They fed the model information from NASA satellites to keep current conditions up-to-date, and predicted how each storm would develop and move across the Atlantic. Though the model wasn’t perfect, it did predict Hurricane Katrina very well. The model is also running through the 2006 hurricane season in a project called MAP '06.
Image and animations by Perkins, de La Beaujardiere, and Shirah, NASA GSFC Scientific Visualization Studio.