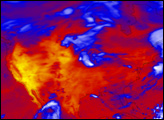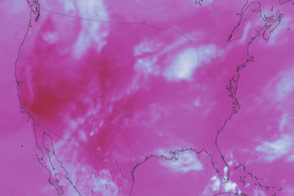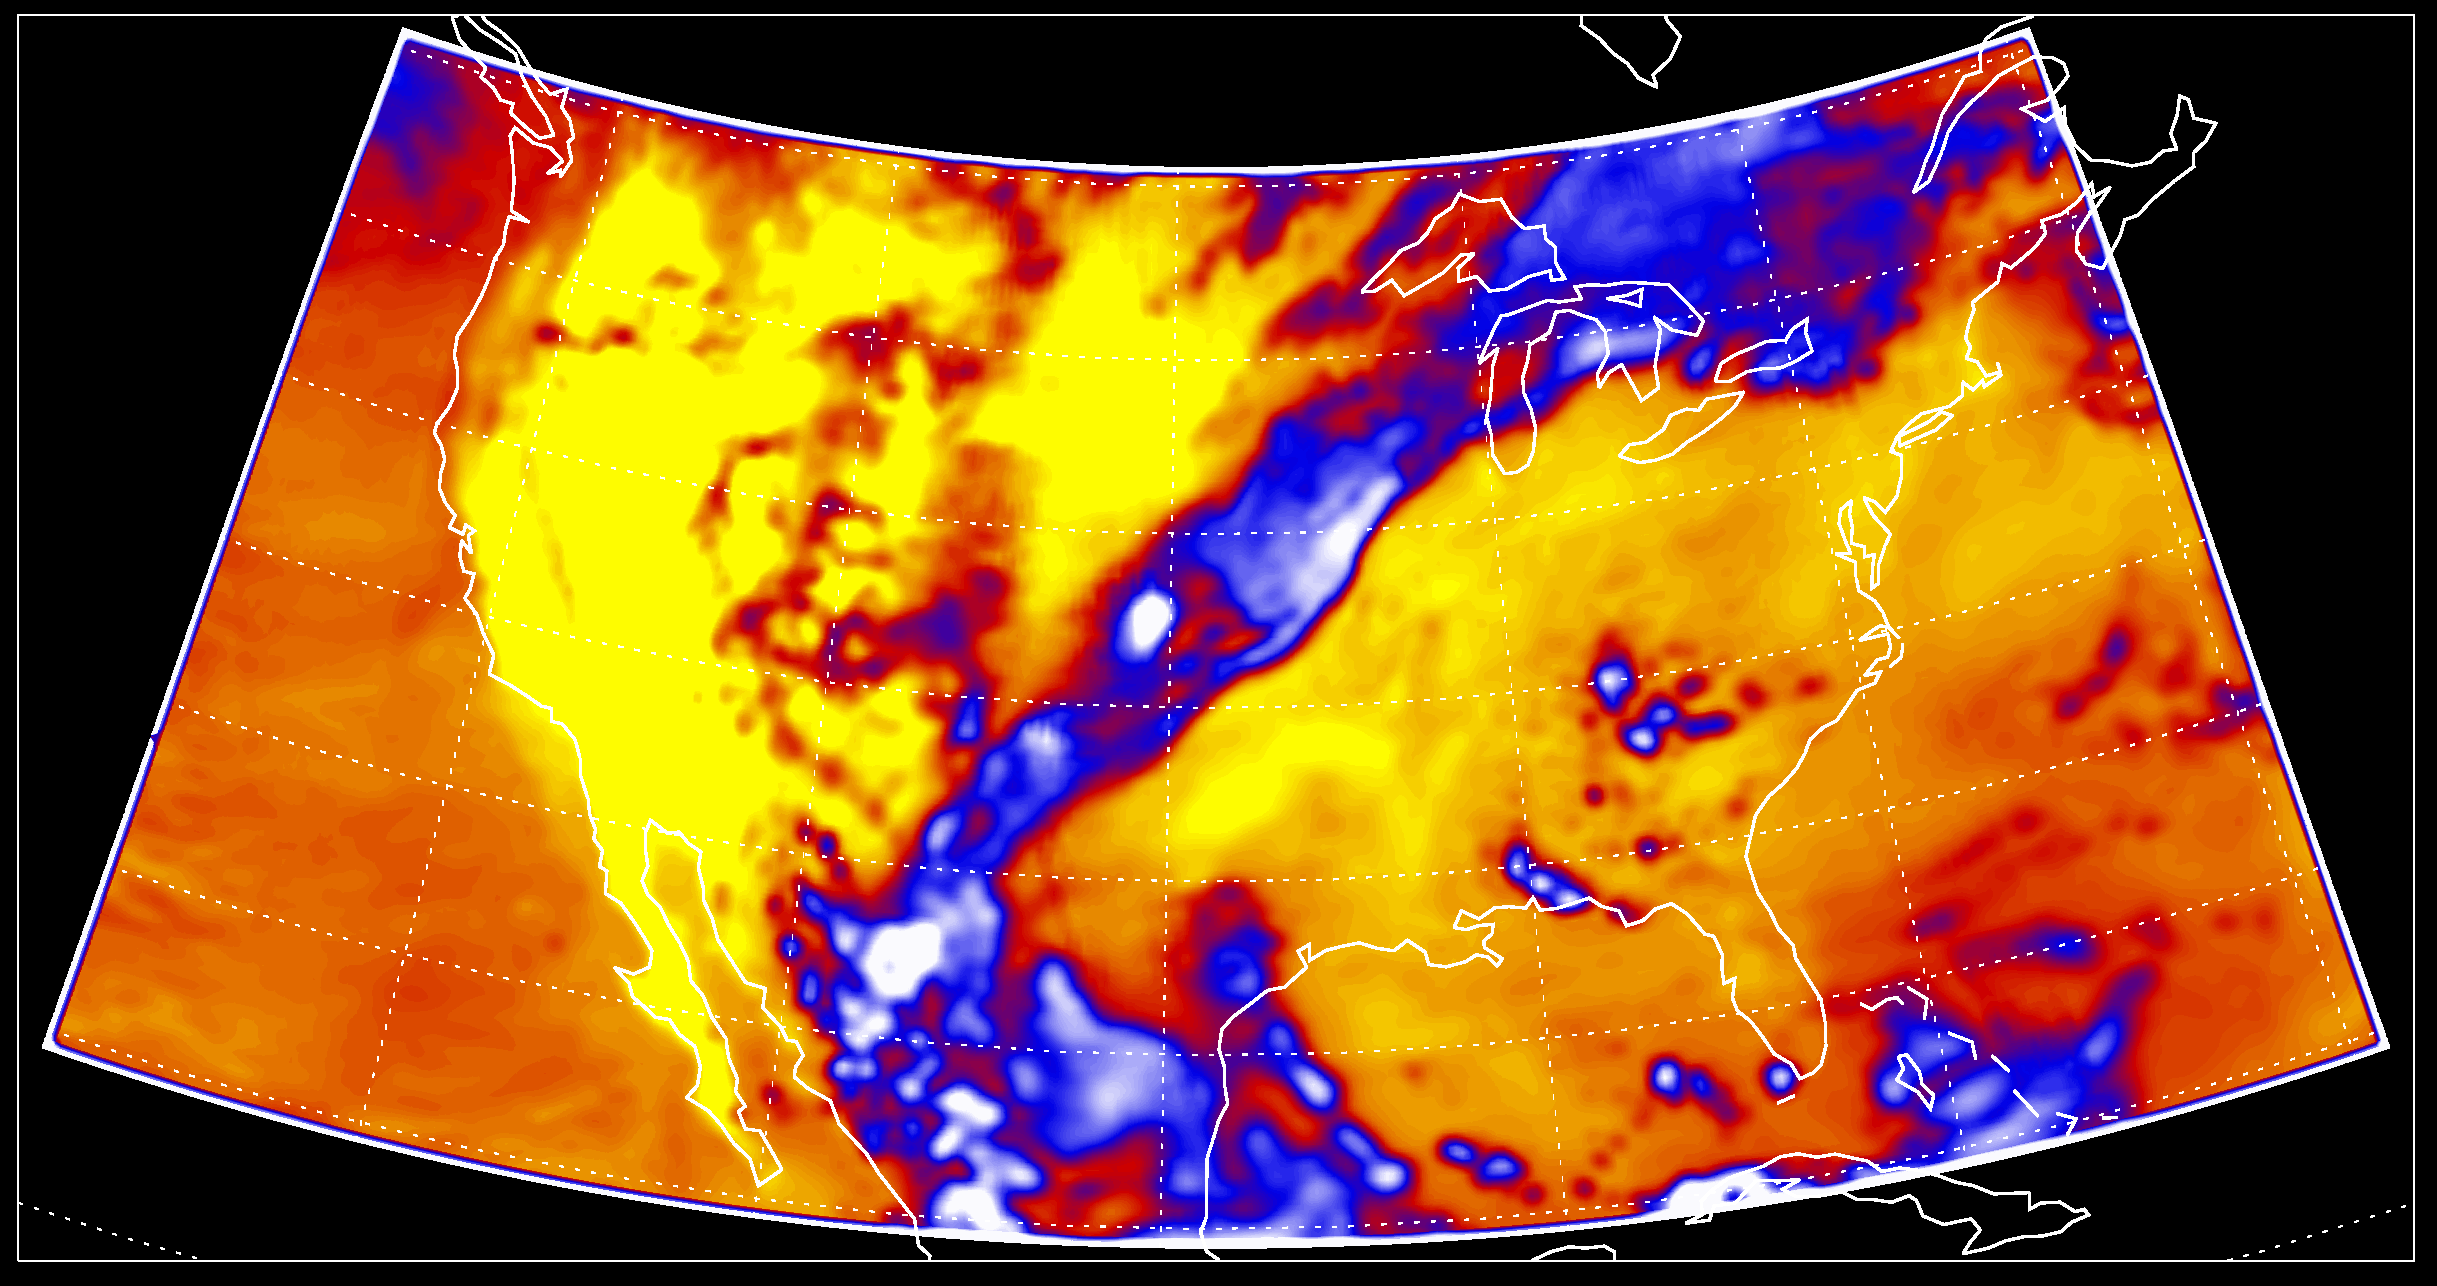
The last two weeks of July and the first week of August 2006 brought unusually hot temperatures to much of the United States, with triple-digit temperatures linked to 136 deaths in California and possibly 20 more in the East, according to the Associated Press. On August 2, a cloudy, low-pressure system passed from west to east across the country, bringing some relief to the East coast and putting an end to a nationwide heat wave. This image from NASA’s Clouds and the Earth's Radiant Energy System (CERES) sensor on the Aqua satellite shows the cool clouds as a ribbon of blue and white draped across North America from the Great Lakes in the northeast to northern Mexico in the southwest.
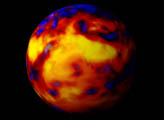
CERES monitors both solar energy reflected from the Earth, called shortwave radiation, and heat energy emitted from the Earth, called longwave radiation. In this image, heat energy radiated from the Earth (in watts per square meter) is shown in shades of yellow, red, blue and white. The brightest-yellow areas are the hottest and are emitting the most energy out to space, while the dark blue areas and the bright white clouds are much colder, and are emitting the least energy. Increasing temperature, decreasing water vapor, and decreasing clouds will all tend to increase the ability of the Earth to shed heat out to space.
The animation is a sequence of CERES data from July 20 to August 6, 2006, and it further illustrates the oppressive heat across much of the United States. The animation shows the movement of clouds and cool air from Canada, over the Rocky Mountains, and across the Midwest. While the East Coast seems to have felt some relief, California and many Western states experienced very high temperatures for most of the observed period.
NASA images by Takmeng Wong with the CERES Science Team at NASA Langley Research Center.