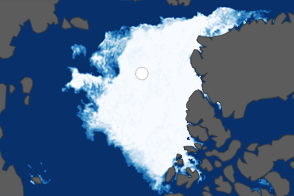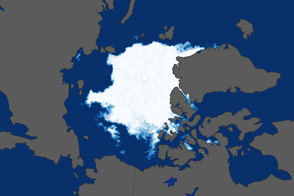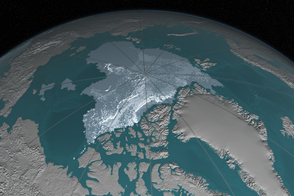

In September 2011, sea ice covering the Arctic Ocean declined to the second-lowest extent on record. Satellite data from NASA and the National Snow and Ice Data Center (NSIDC) showed that the summertime ice cover narrowly avoided a new record low.
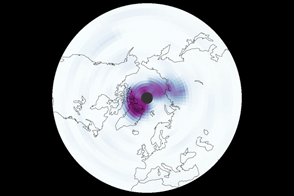
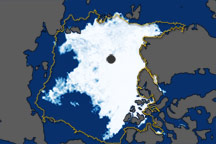
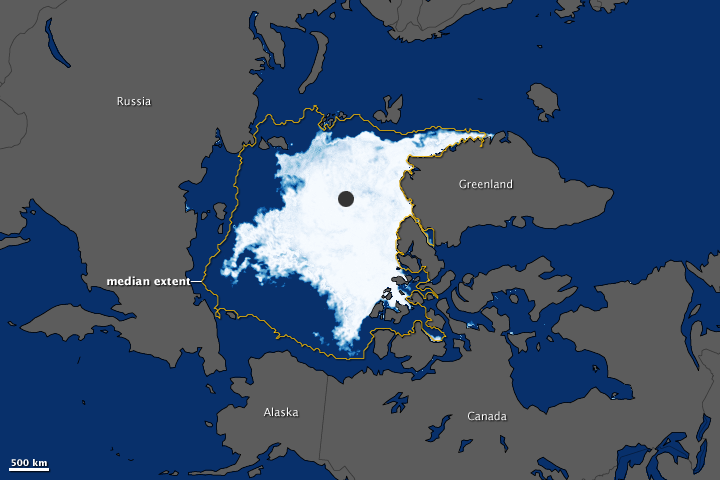
The image above was made from observations collected by the Advanced Microwave Scanning Radiometer (AMSR-E) on NASA’s Aqua satellite. The map—which looks down on the North Pole—depicts sea ice extent on September 9, 2011, the date of minimum extent for the year. The animation (link below the image) shows the growth and decline of sea ice from September 2010 to September 2011.
Ice-covered areas range in color from white (highest concentration) to light blue (lowest concentration). Open water is dark blue, and land masses are gray. The yellow outline shows the median minimum ice extent for 1979–2000; that is, areas that were at least 15 percent ice-covered in at least half the years between 1979 and 2000.
Melt season in 2011 brought higher-than-average summer temperatures, but not the unusual weather conditions that contributed to the extreme melt of 2007, the record low. “Atmospheric and oceanic conditions were not as conducive to ice loss this year, but the melt still neared 2007 levels,” said Walt Meier of NSIDC. “This probably reflects loss of multi-year ice in the Beaufort and Chukchi seas, as well as other factors that are making the ice more vulnerable.”
The low sea ice level in 2011 fits the pattern of decline over the past three decades, said Joey Comiso of NASA’s Goddard Space Flight Center. Since 1979, September Arctic sea ice extent has declined by 12 percent per decade.
“The sea ice is not only declining; the pace of the decline is becoming more drastic,” he noted. “The older, thicker ice is declining faster than the rest, making for a more vulnerable perennial ice cover.”
While the sea ice extent did not dip below the record, the area did drop slightly lower than 2007 levels for about ten days in early September 2011. Sea ice “area” differs from “extent” in that it equals the actual surface area covered by ice, while extent includes any area where ice covers at least 15 percent of the ocean.
Arctic sea ice extent on September 9, 2011, was 4.33 million square kilometers (1.67 million square miles). Averaged over the month of September, ice extent was 4.61 million square kilometers (1.78 million square miles). This places 2011 as the second lowest ice extent for both the daily minimum and the monthly average. Ice extent was 2.43 million square kilometers (938,000 square miles) below the 1979 to 2000 average.
Climate models have suggested that the Arctic could lose almost all of its summer ice cover by 2100, but in recent years, ice extent has declined faster than the models predicted.