The El Niño climate phenomenon involves everything from changes in sea surface temperature and air pressure over the Pacific Ocean near the equator to changes in the amount of long-wave radiation (emitted heat) leaving the ocean. But for most people, the most interesting and important feature of the El Niño-La Niña climate pattern is the dramatic impact it can have on where and how much it rains.
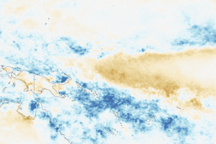
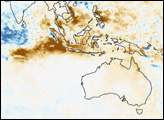
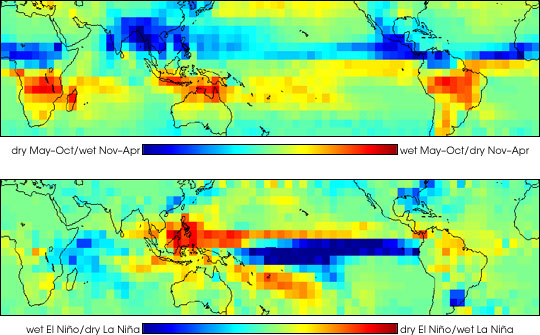
Scientists at NASA's Jet Propulsion Laboratory and Goddard Space Flight Center used five years of rainfall observations collected by the Tropical Rainfall Measuring Mission satellite to identify the strongest influences on global rainfall patterns. The two major players in global precipitation are presented in the maps above: seasonal change (top) and El Niño-la Niña cycles (bottom). Blue and red areas are like opposite sides of the climate coin. When one area is wet, the other is dry. Green areas show the smallest changes from season to season and year to year.
The most obvious month-to-month, long-distance relationship is the one between areas mostly north of the equator, which generally get their rain from November through April, and areas south of the equator, which get their rain between May and October. In other words, when southern Africa, northern Australia, and South America are dry, sub-Saharan Africa, India and Southeast Asia, and Central America are wet, and vice versa.
When the scientists looked at rainfall measurements on a year-to-year basis, a second pattern emerged. The data revealed that the occurrence of El Niño or La Niña was the single biggest factor that explained global rainfall anomalies. The eastern Pacific (left of image center) and the western Pacific (right of center) are connected over thousands of miles by an inverse relationship in which the central and western Pacific off South America get much more rain than normal during El Niño events, while the eastern Pacific between Southeast Asia and Australia often suffers drought. The reverse pattern occurs during La Niña years.
The seasonal analysis was based on TRMM rainfall data from December 1997 to December 2003. The interannual analysis was based on TRMM rainfall data from January 1998 to December 2002. To read more details about the analysis, visit the scientists’ Website at NASA’s Jet Propulsion Lab.
NASA Images courtesy JPL TRMM team