From its outset, the 2004 meteorological year was a hot one, according to new results from scientists at NASA's Goddard Institute for Space Studies. Average global surface temperatures in both December 2003 (the first month of the 2004 meteorological year) and February 2004 were 0.66 degrees Celsius above the long-term average (1951-1980). Overall, 2004 temperatures were 0.48 degrees Celsius above the climatological average. The high temperatures of 2004 make it the fourth hottest year since the late 1800s, the time that most scientists recognize as the start of accurate meteorological record keeping.
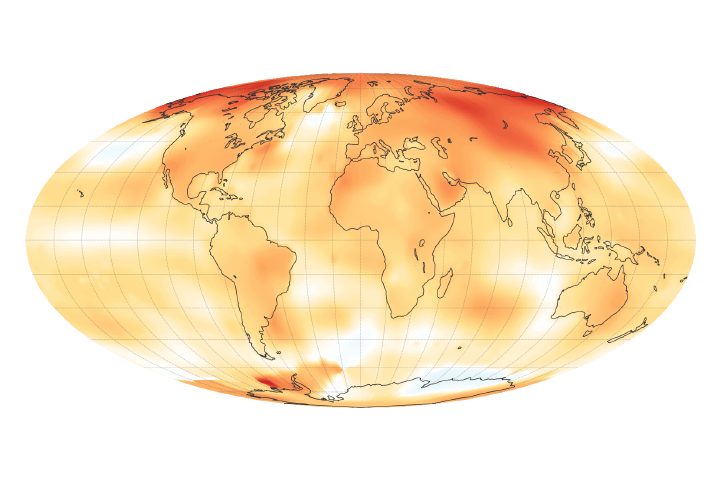
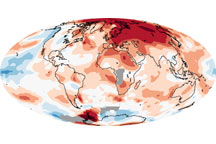
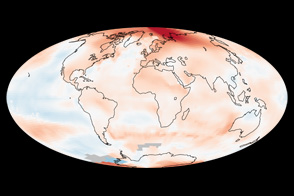
The map above shows places on Earth where the average surface temperatures were either warmer (yellows and reds), cooler (blues), or the same as (white) the climatological average. The areas where temperatures were most above average were Alaska (upper right), the Antarctic Peninsula (bottom), and Central Asia (right of center), particularly the region just east of the Caspian Sea.
When the average global temperature anomaly for each year is displayed on a graph, the upward trend since the late 1800s is clear, and so is the more rapid increase in temperatures since about 1980. The average global temperature anomaly for each year on record is indicated on the graph with light red dots. The solid red line is a five-year running average (the average for a five-year period centered on a given year). Although there is considerable "jumping around" from year to year, the trend is clear: global average surface temperatures are going up.
For more imagery and information about trends in Earth's surface temperatures, visit Global Temperature Trends: 2004 Summation at the Goddard Institute for Space Studies.
Image courtesy NASA Goddard Institute for Space Studies