
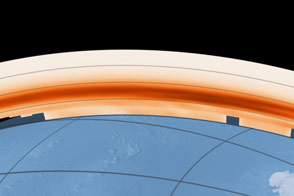
Ozone is Earth's natural sunscreen, shielding life from excessive amounts of ultraviolet radiation. But Earth's ozone layer has been damaged by well-intentioned chemicals—chlorofluorocarbons, used for refrigerants and aerosol spray-cans—that have the unintended consequence of destroying ozone molecules.
In the late 1980s, governments around the world woke up to the destruction of the ozone layer and negotiated the Montreal Protocol, an international treaty to phase out ozone-depleting chemicals. The treaty included a requirement that scientists regularly assess and report on the health of the ozone layer, particularly the annual Antarctic ozone hole. In January 2011, the Ozone Secretariat of the United Nations Environment Programme released its latest report and noted that the Protocol has “protected the stratospheric ozone layer from much higher levels of depletion...[and] provided substantial co-benefits by reducing climate change.”
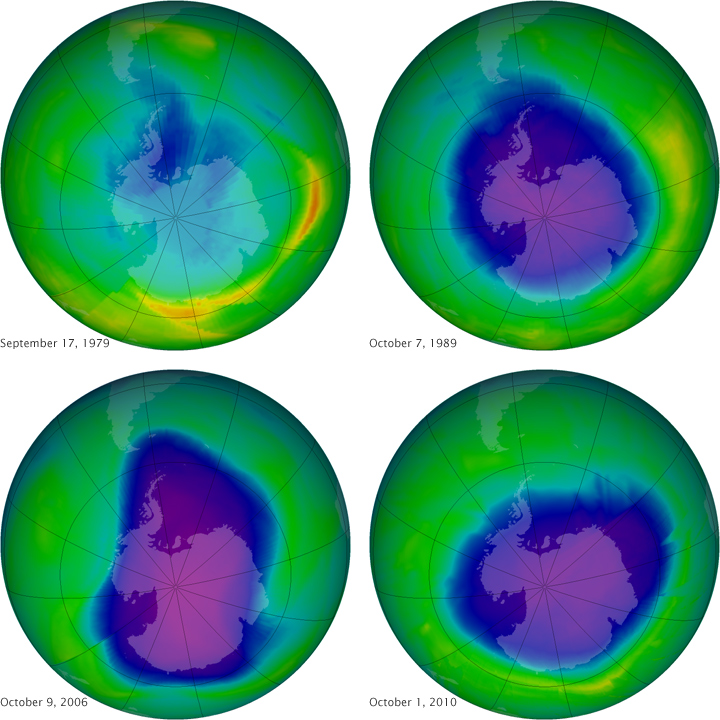
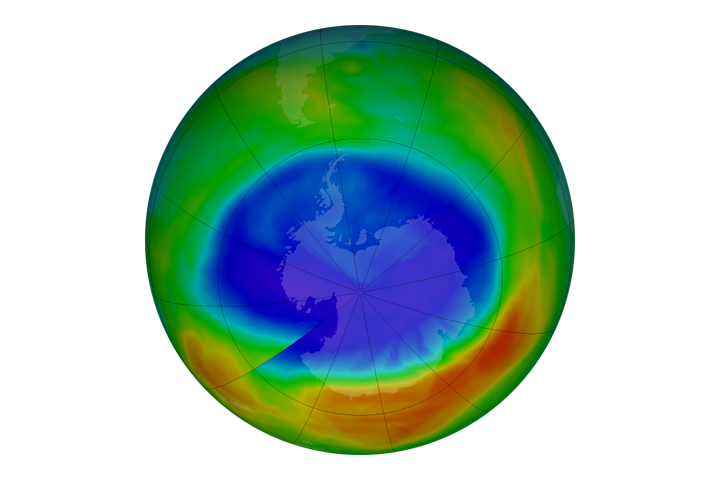
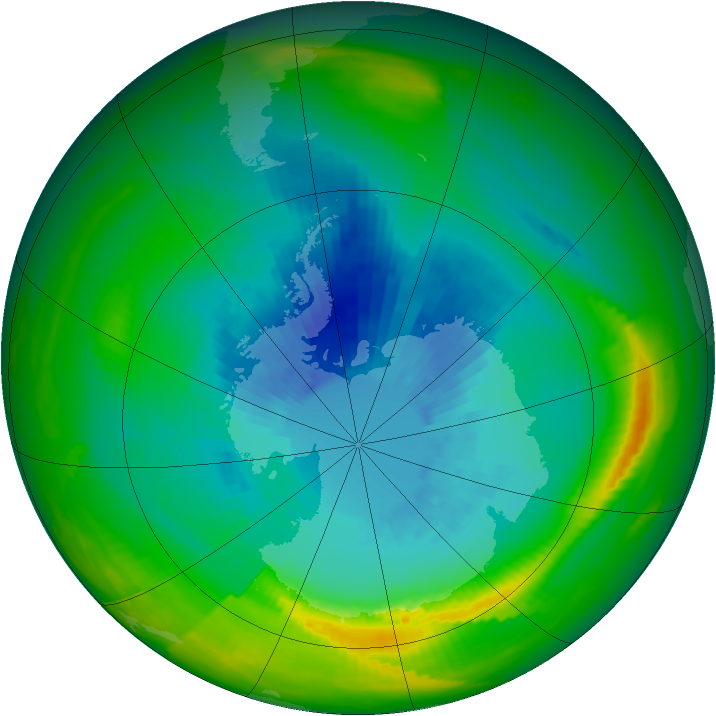
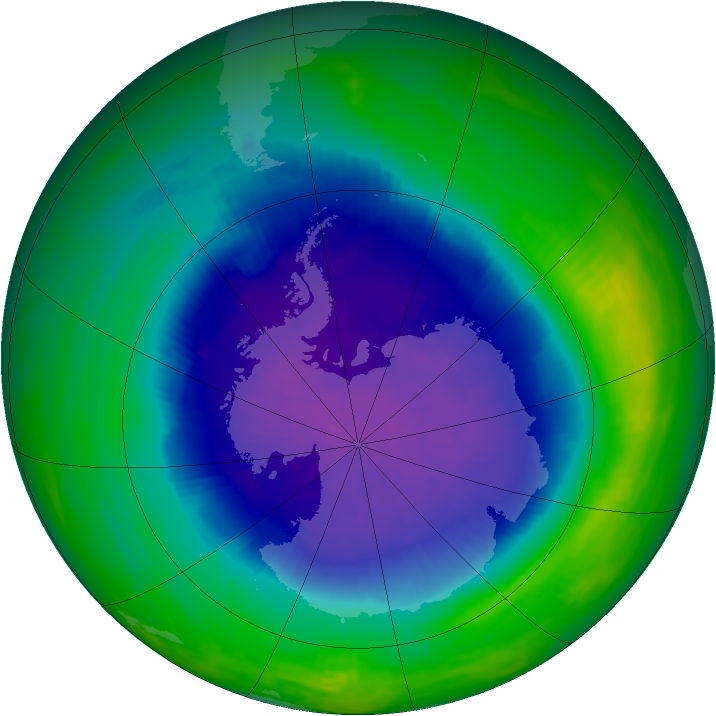
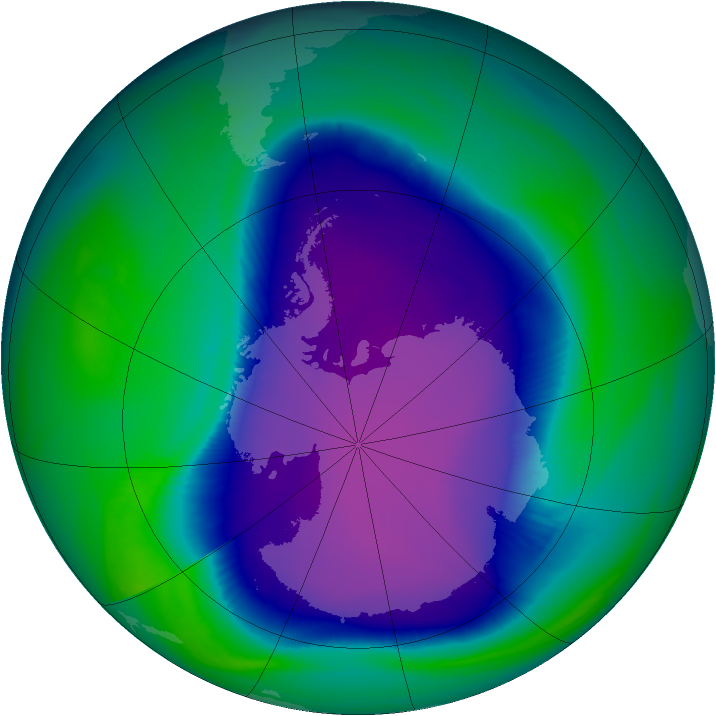
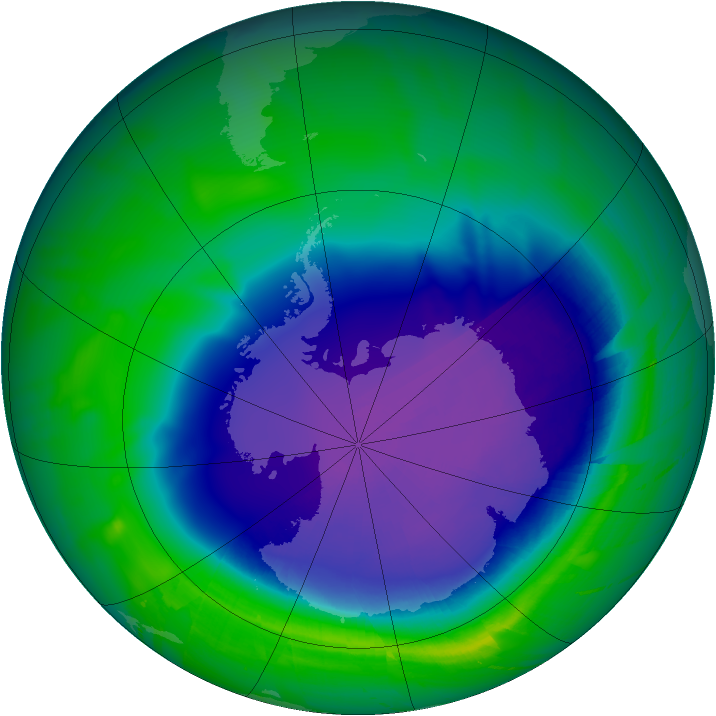
This series of images above shows the Antarctic ozone hole on the day of its maximum depletion in four different years; that is, the days with the thinnest ozone layer as measured in Dobson Units (DU). The measurements were made by NASA’s Total Ozone Mapping Spectrometer (TOMS) instruments from 1979–2003 and by the Royal Netherlands Meteorological Institute (KNMI) Ozone Monitoring Instrument (OMI) from 2004–present. Purple and dark blue areas are part of the ozone hole.
On September 17, 1979 (top left), the first year in which ozone was measured by satellite, the ozone level was at 194 Dobson Units. On October 7, 1989 (top right), the year that the Montreal Protocol went into force, ozone dropped to 108 DU. On October 9, 2006 (bottom left), ozone measured 82 DU. By October 1, 2010, the value was back up to 118 DU.
The lowest value (deepest hole) ever recorded was 73 Dobson Units on September 30, 1994, while the broadest hole occurred on September 29, 2000, when the ozone-depleted area stretched 29.9 million square kilometers. The record for mean size of the ozone hole—the greatest extent over a one-month window—was September 7 to October 13, 2006, when the hole reached 26.2 million square kilometers. The mean ozone hole in 2010 was 22.2 million square kilometers.
In their 2010 report, the science advisers to the Montreal Protocol found that:
NASA images courtesy NASA Ozone Hole Watch. Caption by Michael Carlowicz.

