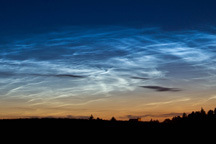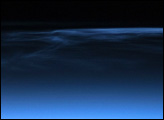

Scientists have a good reason to track noctilucent or polar mesospheric clouds: they are a pretty good gauge of even the tiniest changes in the atmosphere. These “night-shining clouds,” as they are sometimes called, are thin, wavy ice clouds that form at very high altitudes and reflect sunlight long after the Sun has dropped below the horizon.
To look for changes in the atmosphere, scientist Matthew DeLand (of Science Systems and Applications Inc. and NASA’s Goddard Space Flight Center) has been monitoring polar mesospheric clouds with instruments that were actually designed to study ozone, including the Ozone Monitoring Instrument (OMI) on NASA’s Aura satellite. OMI provides more detailed and frequent observations than previous instruments, giving DeLand a way to refine his previous measurements of a long-term trend towards more and brighter noctilucent clouds linked to rising greenhouse gases.
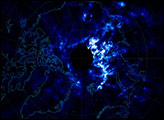
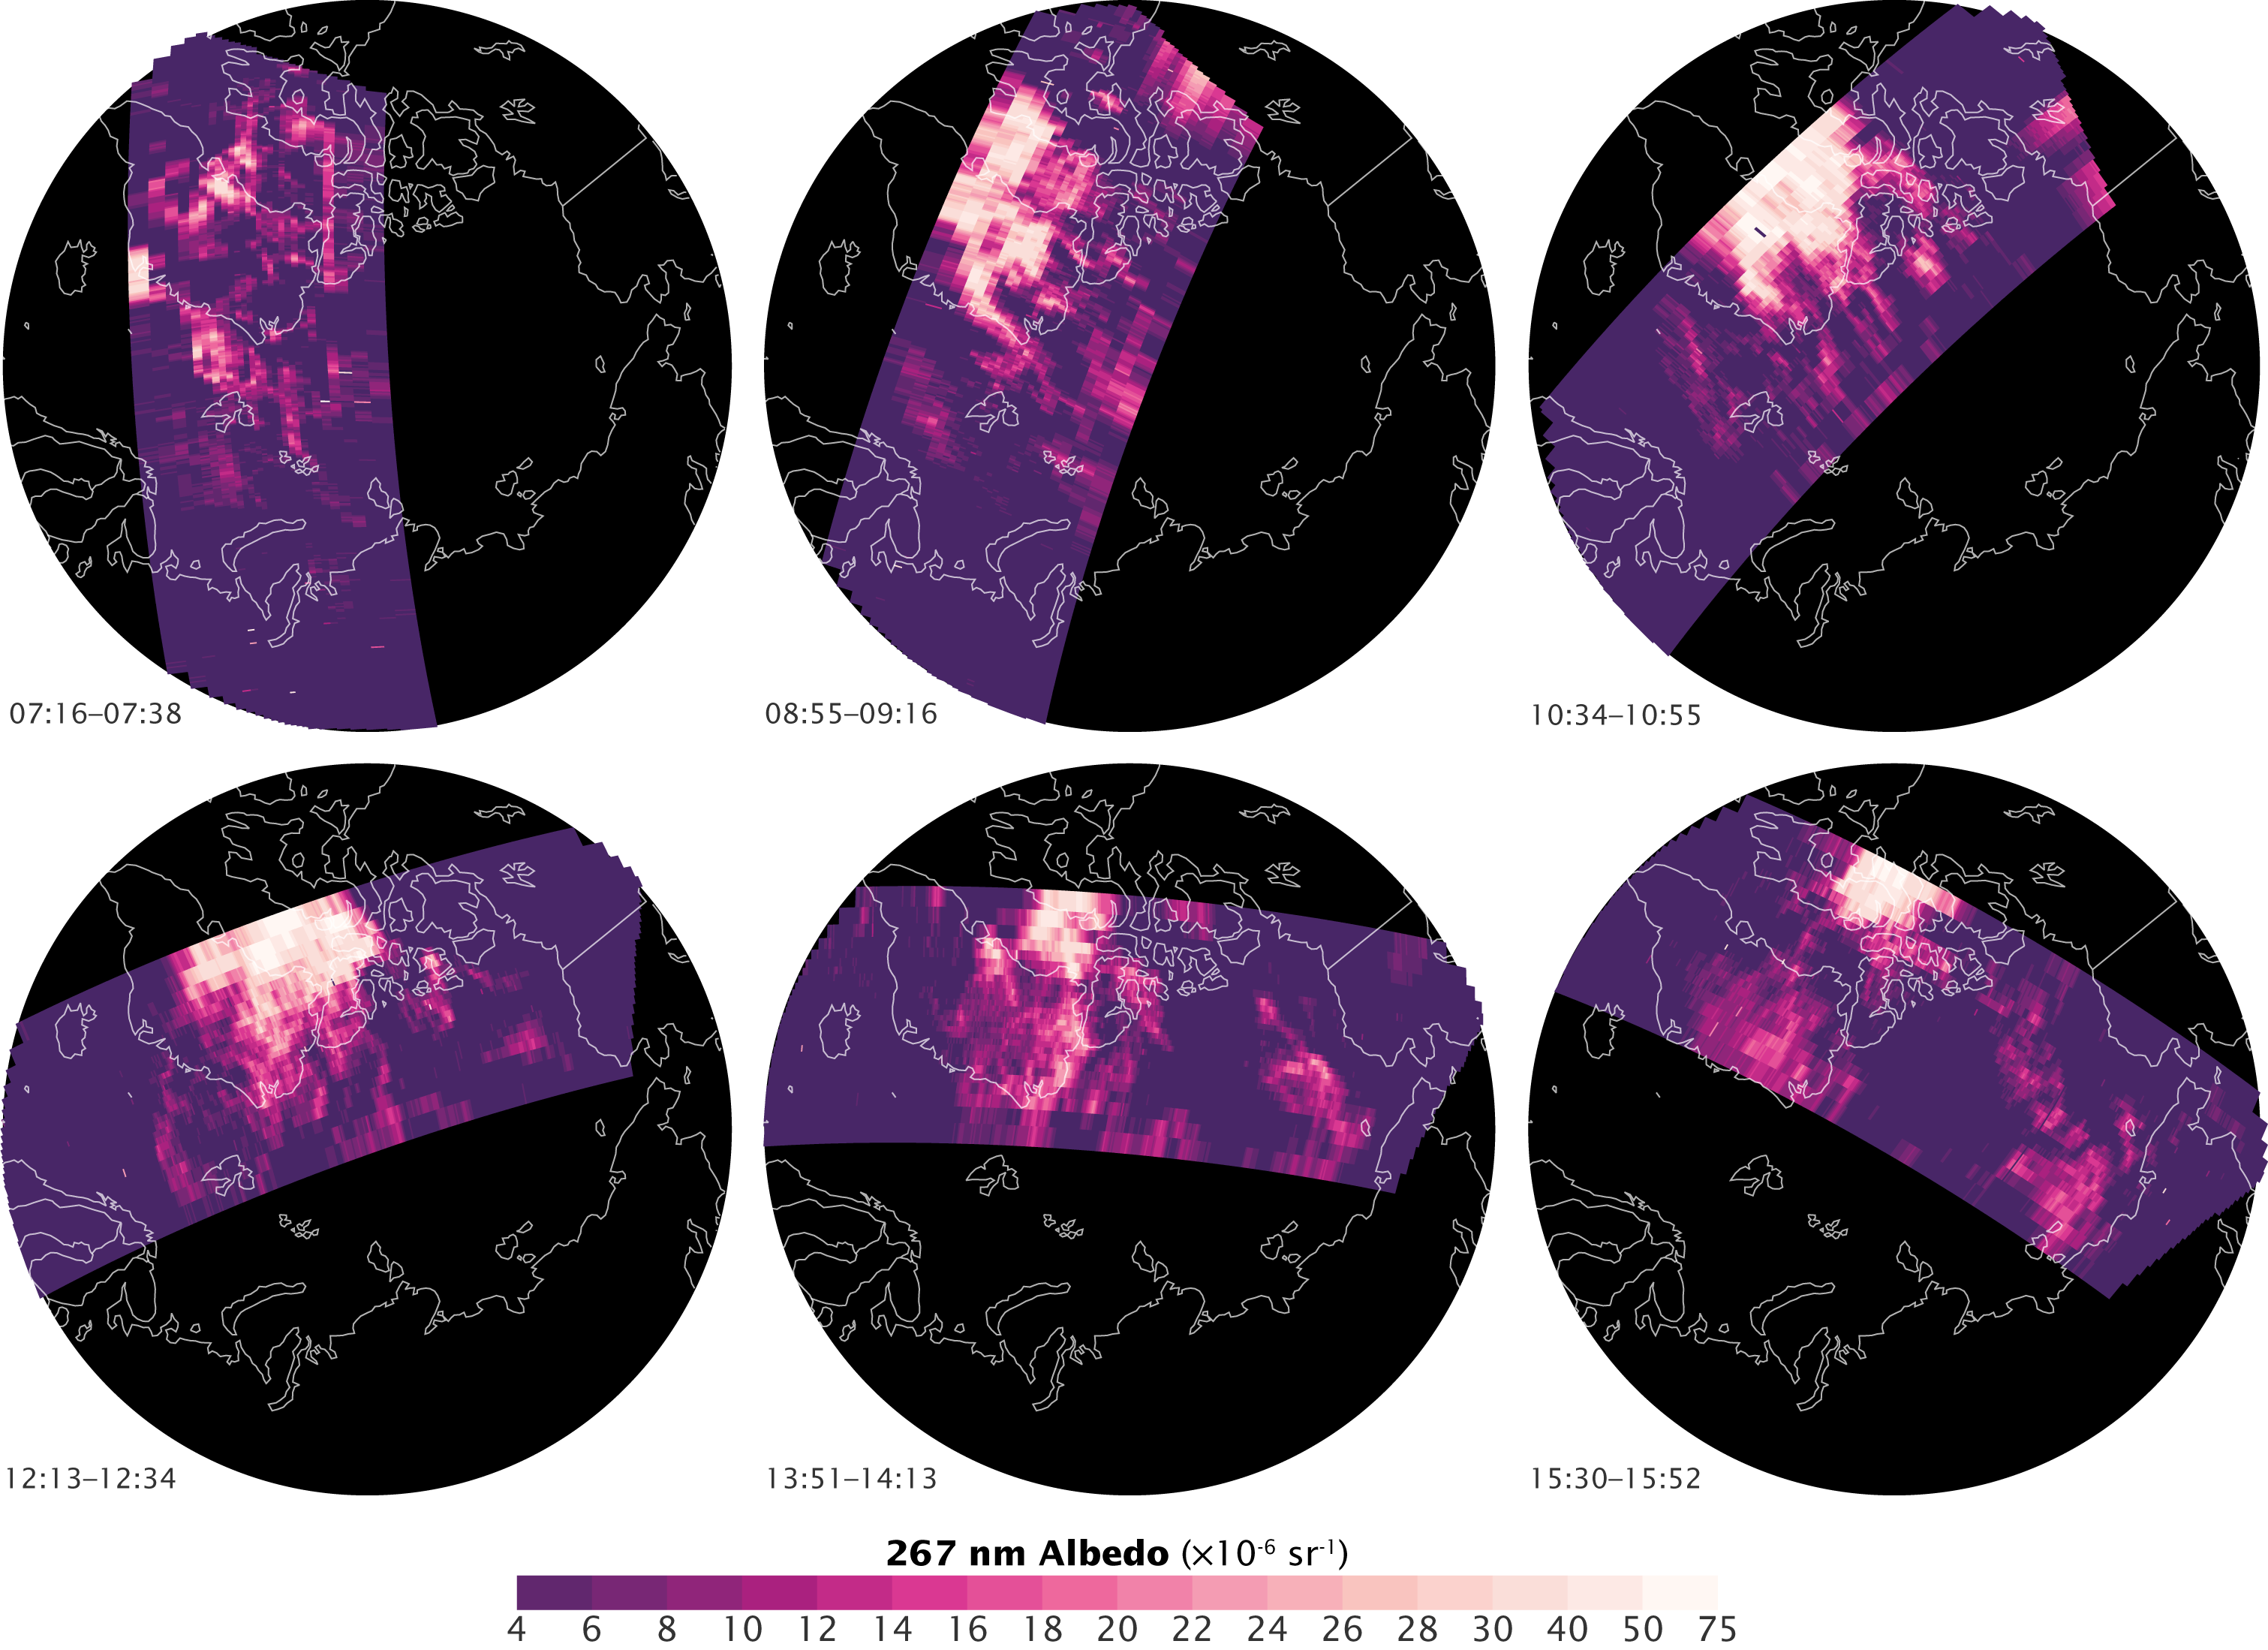
These images show OMI measurements of polar mesospheric clouds on July 10, 2007. The clouds, detectable because they are the only things that reflect light in this part of the atmosphere, are shown in white and pink. The Aura satellite travels in a polar orbit, circling from south to north as the Earth turns beneath it. As a result, the satellite gets several opportunities to image the poles every day. This series of images shows the clouds over six consecutive orbits between 7:16 and 15:52 Universal Time. Throughout the day, a wide area of polar mesospheric clouds developed over northern Greenland and Canada, peaking around 10:30 UTC (the third orbit).
Deland first noticed the trend toward more and brighter clouds in measurements from the Solar Backscatter Ultraviolet (SBUV) instruments, which see 23,000 square kilometers (8,800 square miles) at once in a single box (pixel). By contrast, OMI sees 490 square kilometers (189 square miles) in a pixel, making its measurements 47 times more detailed. Because it naturally takes fewer clouds to fill a single OMI pixel, the measurements will provide a useful tool for understanding why SBUV is seeing more and brighter clouds.
The fact that OMI sees the clouds multiple times throughout the day is also significant because it allows DeLand to see how the clouds change within the day. This information is important because it helps him combine data from many sensors to determine how the clouds are changing from decade to decade. SBUV instruments have flown on seven different satellites over the past 32 years, and they have each passed over the poles at slightly different times of the day. If one of the instruments was consistently measuring the clouds at a time when the clouds naturally peak, it could create a false trend, making it appear that polar mesospheric clouds were getting brighter or more abundant.
With OMI showing how the clouds change throughout the day, DeLand now has an index to help correct the SBUV measurement trends to account for the time of day. The correction allows him to develop a more accurate view of the long-term trend. Even with the corrections, the trend indicates that the atmosphere has been responding to increased greenhouse gases over the past 30 years.
Maps by Robert Simmon, adapted from Polar mesospheric clouds (PMCs) observed by the Ozone Monitoring Instrument (OMI) on Aura. Caption by Holli Riebeek.