
For many people, El Niño means flood-inducing rains or crop-killing drought. El Niño and its counterpart La Niña alter weather patterns across the world. These images show the strongest El Niño and La Niña events of the past twenty years and their impact on rainfall over North and South America. Yearly images from 1985 through 2008 are posted on the Earth Observatory’s World of Change feature El Niño, La Niña, and Rainfall.
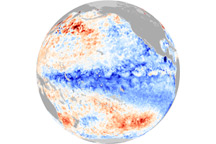
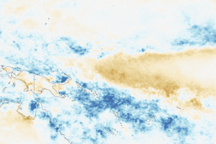
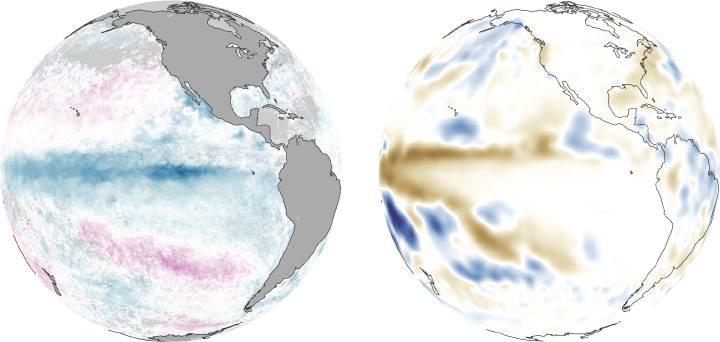
The top image pair shows the El Niño event of 1997. El Niño happens when the ocean warms, as illustrated by the streak of purple in the top left sea surface temperature anomaly image. The ocean warms when the west-blowing trade winds weaken. Warm surface water that would otherwise have been blown into the western Pacific builds in the east. The warm water evaporates easily. It also warms the atmosphere, making it easier for storms to form. The top pair of images shows the direct correlation between warm surface waters and rainfall.
The 1997 El Niño was unusually strong. It brought heavy rain to northwest South America and much of the southern United States. Because the warm water that usually fuels rains in the western Pacific (Australia and Indonesia) stayed in the east, the western Pacific cooled. These cooler ocean temperatures caused drought in Australia and Indonesia, just visible as a streak of brown on the far left side of the globe in the 1997 rainfall anomaly image.
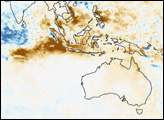
The lower image pair shows La Niña in 1988. La Niña occurs when the eastern Pacific off the coast of South America cools. This cooling shows up as a streak of blue in the sea surface temperature anomaly image, lower left.
The unusually cold ocean cools the atmosphere above it. The cool air is dense; it doesn’t rise and form storms easily. As a result, less rain falls over the cold waters in the eastern equatorial Pacific. The brown tones in the rainfall anomaly image, top right, reveal that the drought reached Peru and Ecuador in northwest South America. The changes in the atmosphere change the flow of winds and weather systems around the world. As the image shows, drought settled over the southeastern United States, the portion of the country that is usually most impacted by El Niño and La Niña. Globally, La Niña causes unusually heavy rain in India, Southeast Asia, Australia, and southeastern Africa.
The sea surface temperature anomaly images compare the average temperature observed by NOAA’s Advanced Very High Resolution Radiometer in December, when El Niño and La Niña events are strongest, to the average ocean surface temperatures the sensor observed in all the Decembers between 1985 and 2008. The rainfall anomaly images are from the Global Precipitation Climatology Project, which blends rainfall data from a number of satellites. The images compare December rainfall with the average December rainfall observed between 1979 and 2008.
NASA Earth Observatory images by Rob Simmon and Jesse Allen, based on data from the National Oceanic and Atmospheric Administration’s Advanced Very High Resolution Radiometer and the Global Precipitation Climatology Project at NASA Goddard Space Flight Center. Caption by Holli Riebeek.