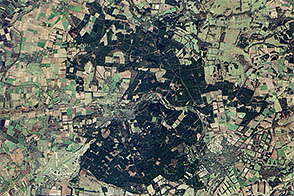
A constellation of satellites monitors our planet, observing phenomena such as storms, fires, and human-engineered changes. Yet not all satellite sensors see the same thing in the same way, and a crucial difference concerns each sensor’s resolution. A pixel is the smallest unit in a satellite image, and the smaller the area covered by a pixel, the more detailed the image. Greater detail, however, comes at a price; high-resolution sensors generally see more details but also smaller total area per image. Which resolution works best depends on what a scientist needs to see—a global, regional, or small-scale phenomenon. For a perspective on Earth observation and satellite resolution, see Why EOS Matters, 10 years later.
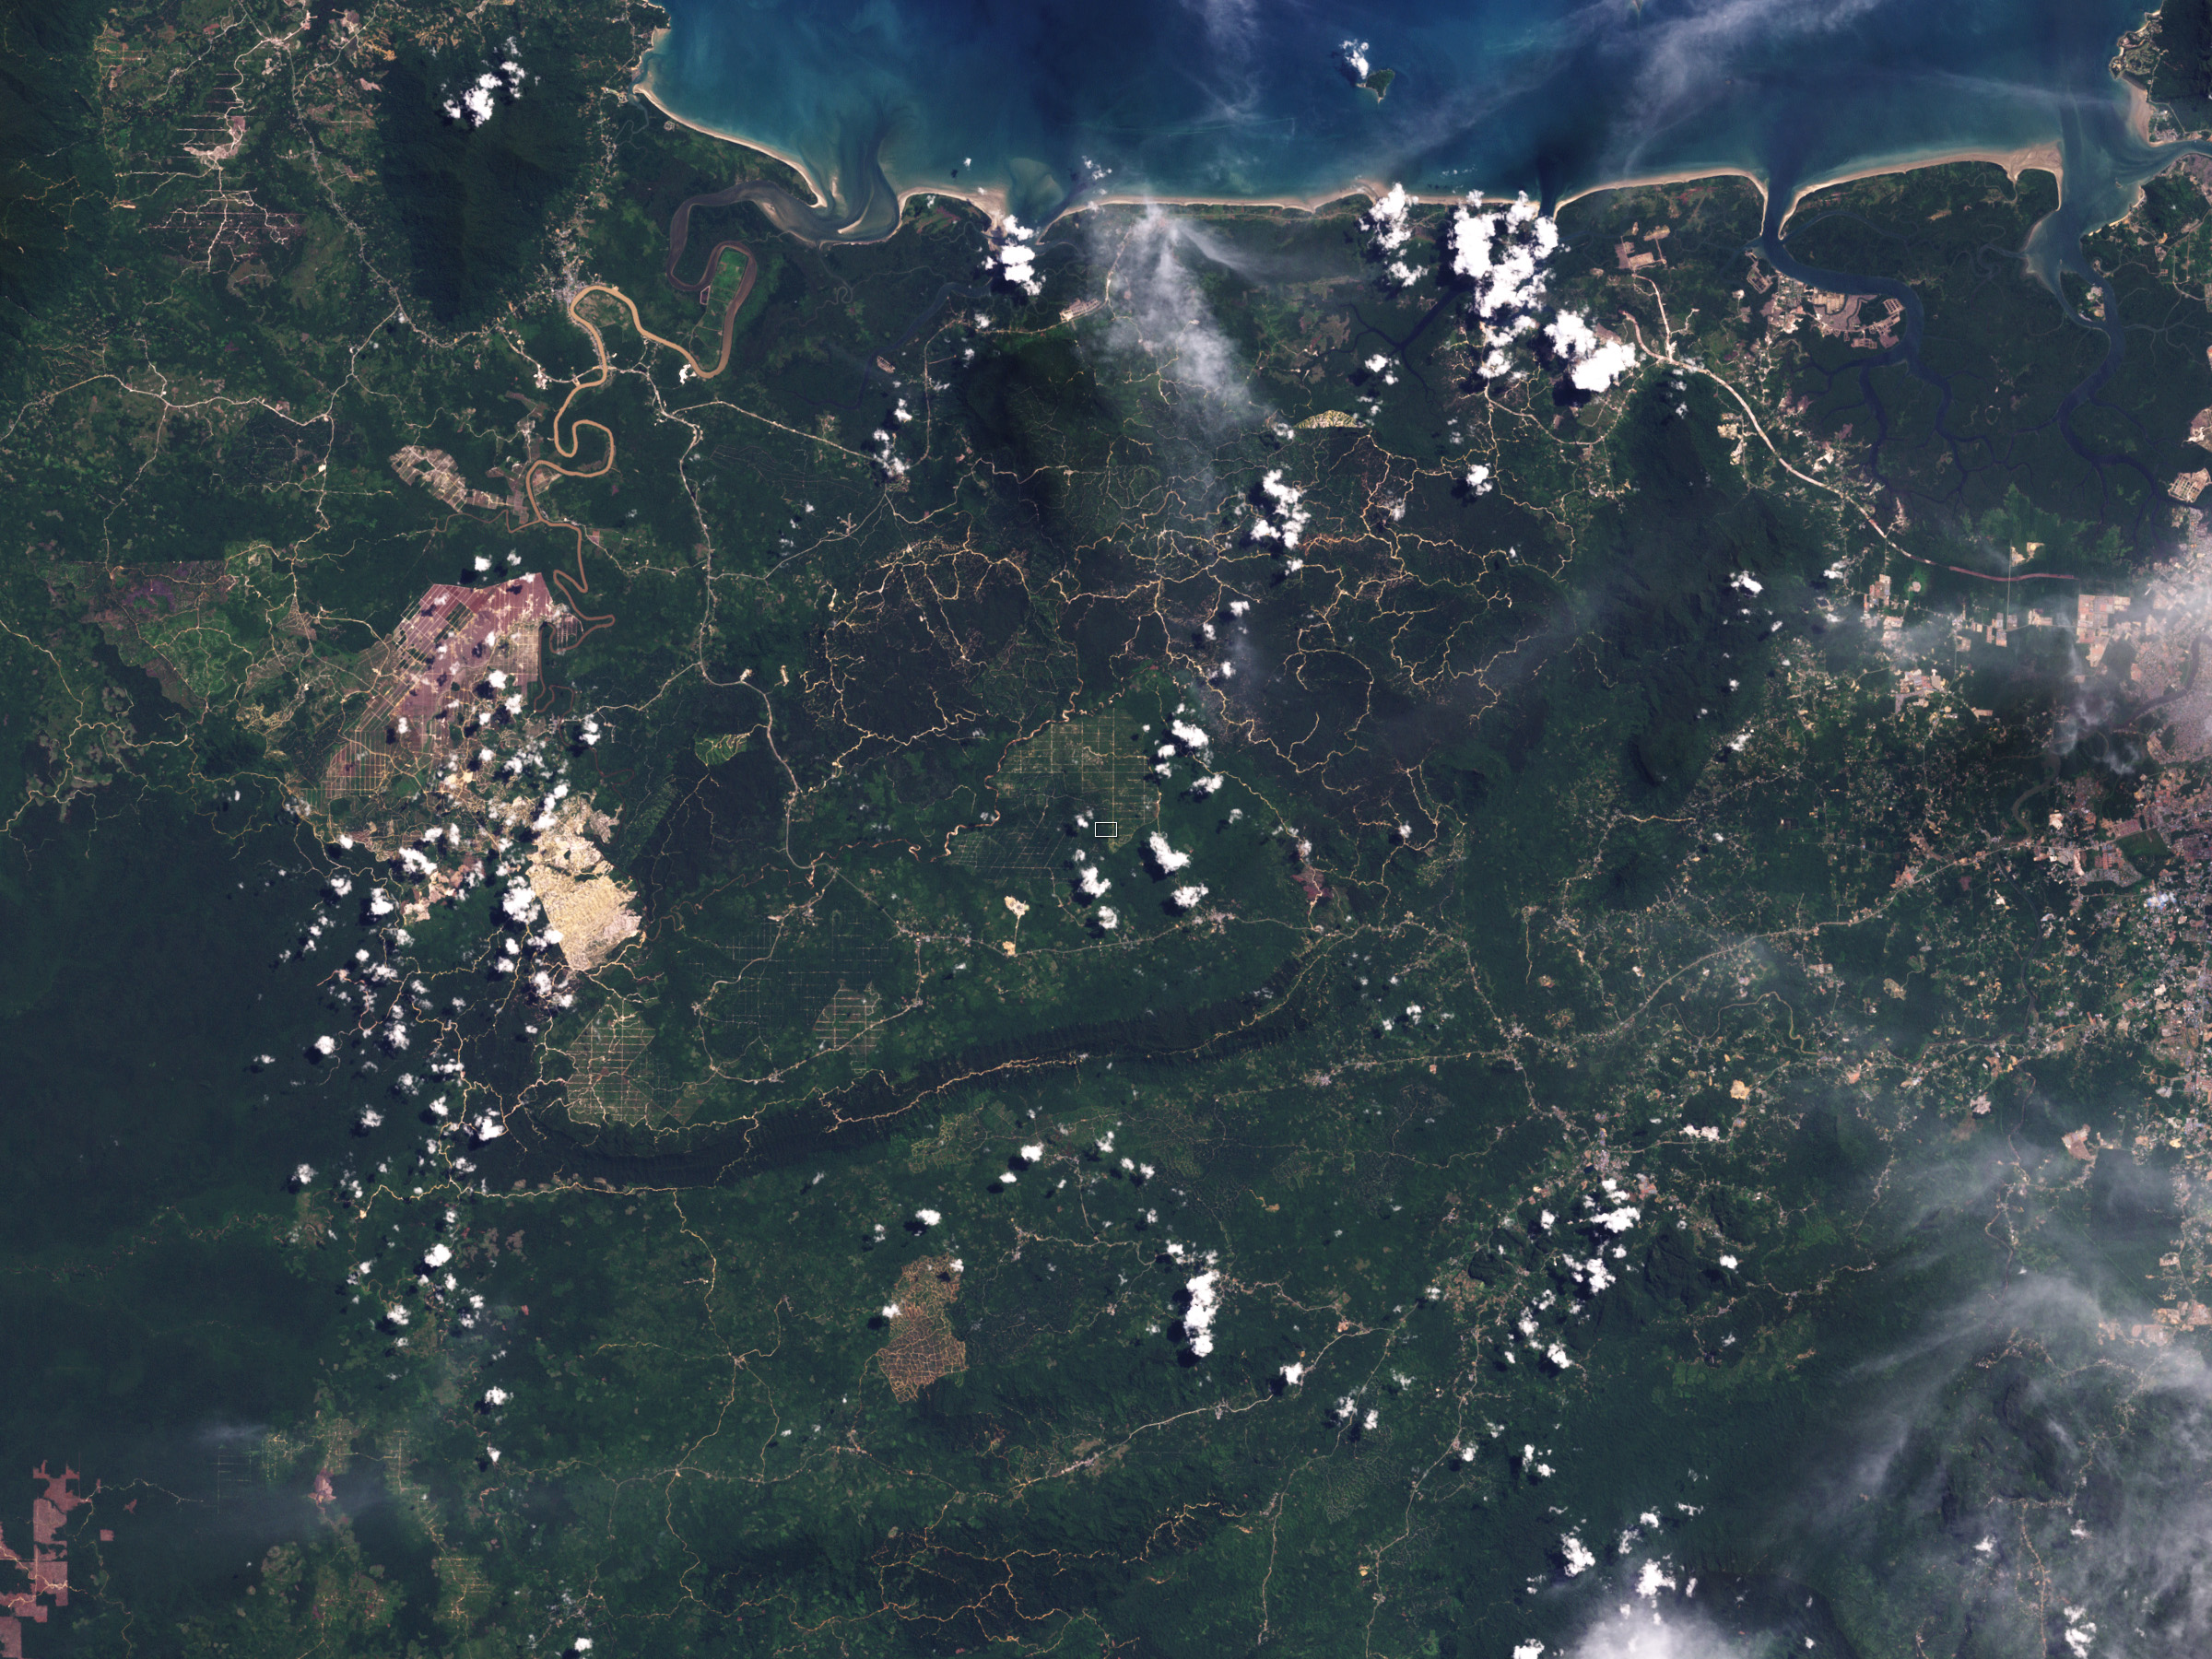
A good example of a phenomenon that scientists need to monitor on local, regional, and global scales is deforestation, which is illustrated in these images. The Enhanced Thematic Mapper plus (ETM+) on NASA’s Landsat 7 satellite captured the top natural-color image on May 27, 2003. The image has a resolution of 30 meters per pixel. Spanning about 22,000 meters, this image shows the difference between plantation and intact forest in part of Malaysian Borneo. The greens of the plantation are paler than those of the surrounding forest, and paths or roads crisscross the groves. The image reveals the overall extent of land-cover change throughout the region.
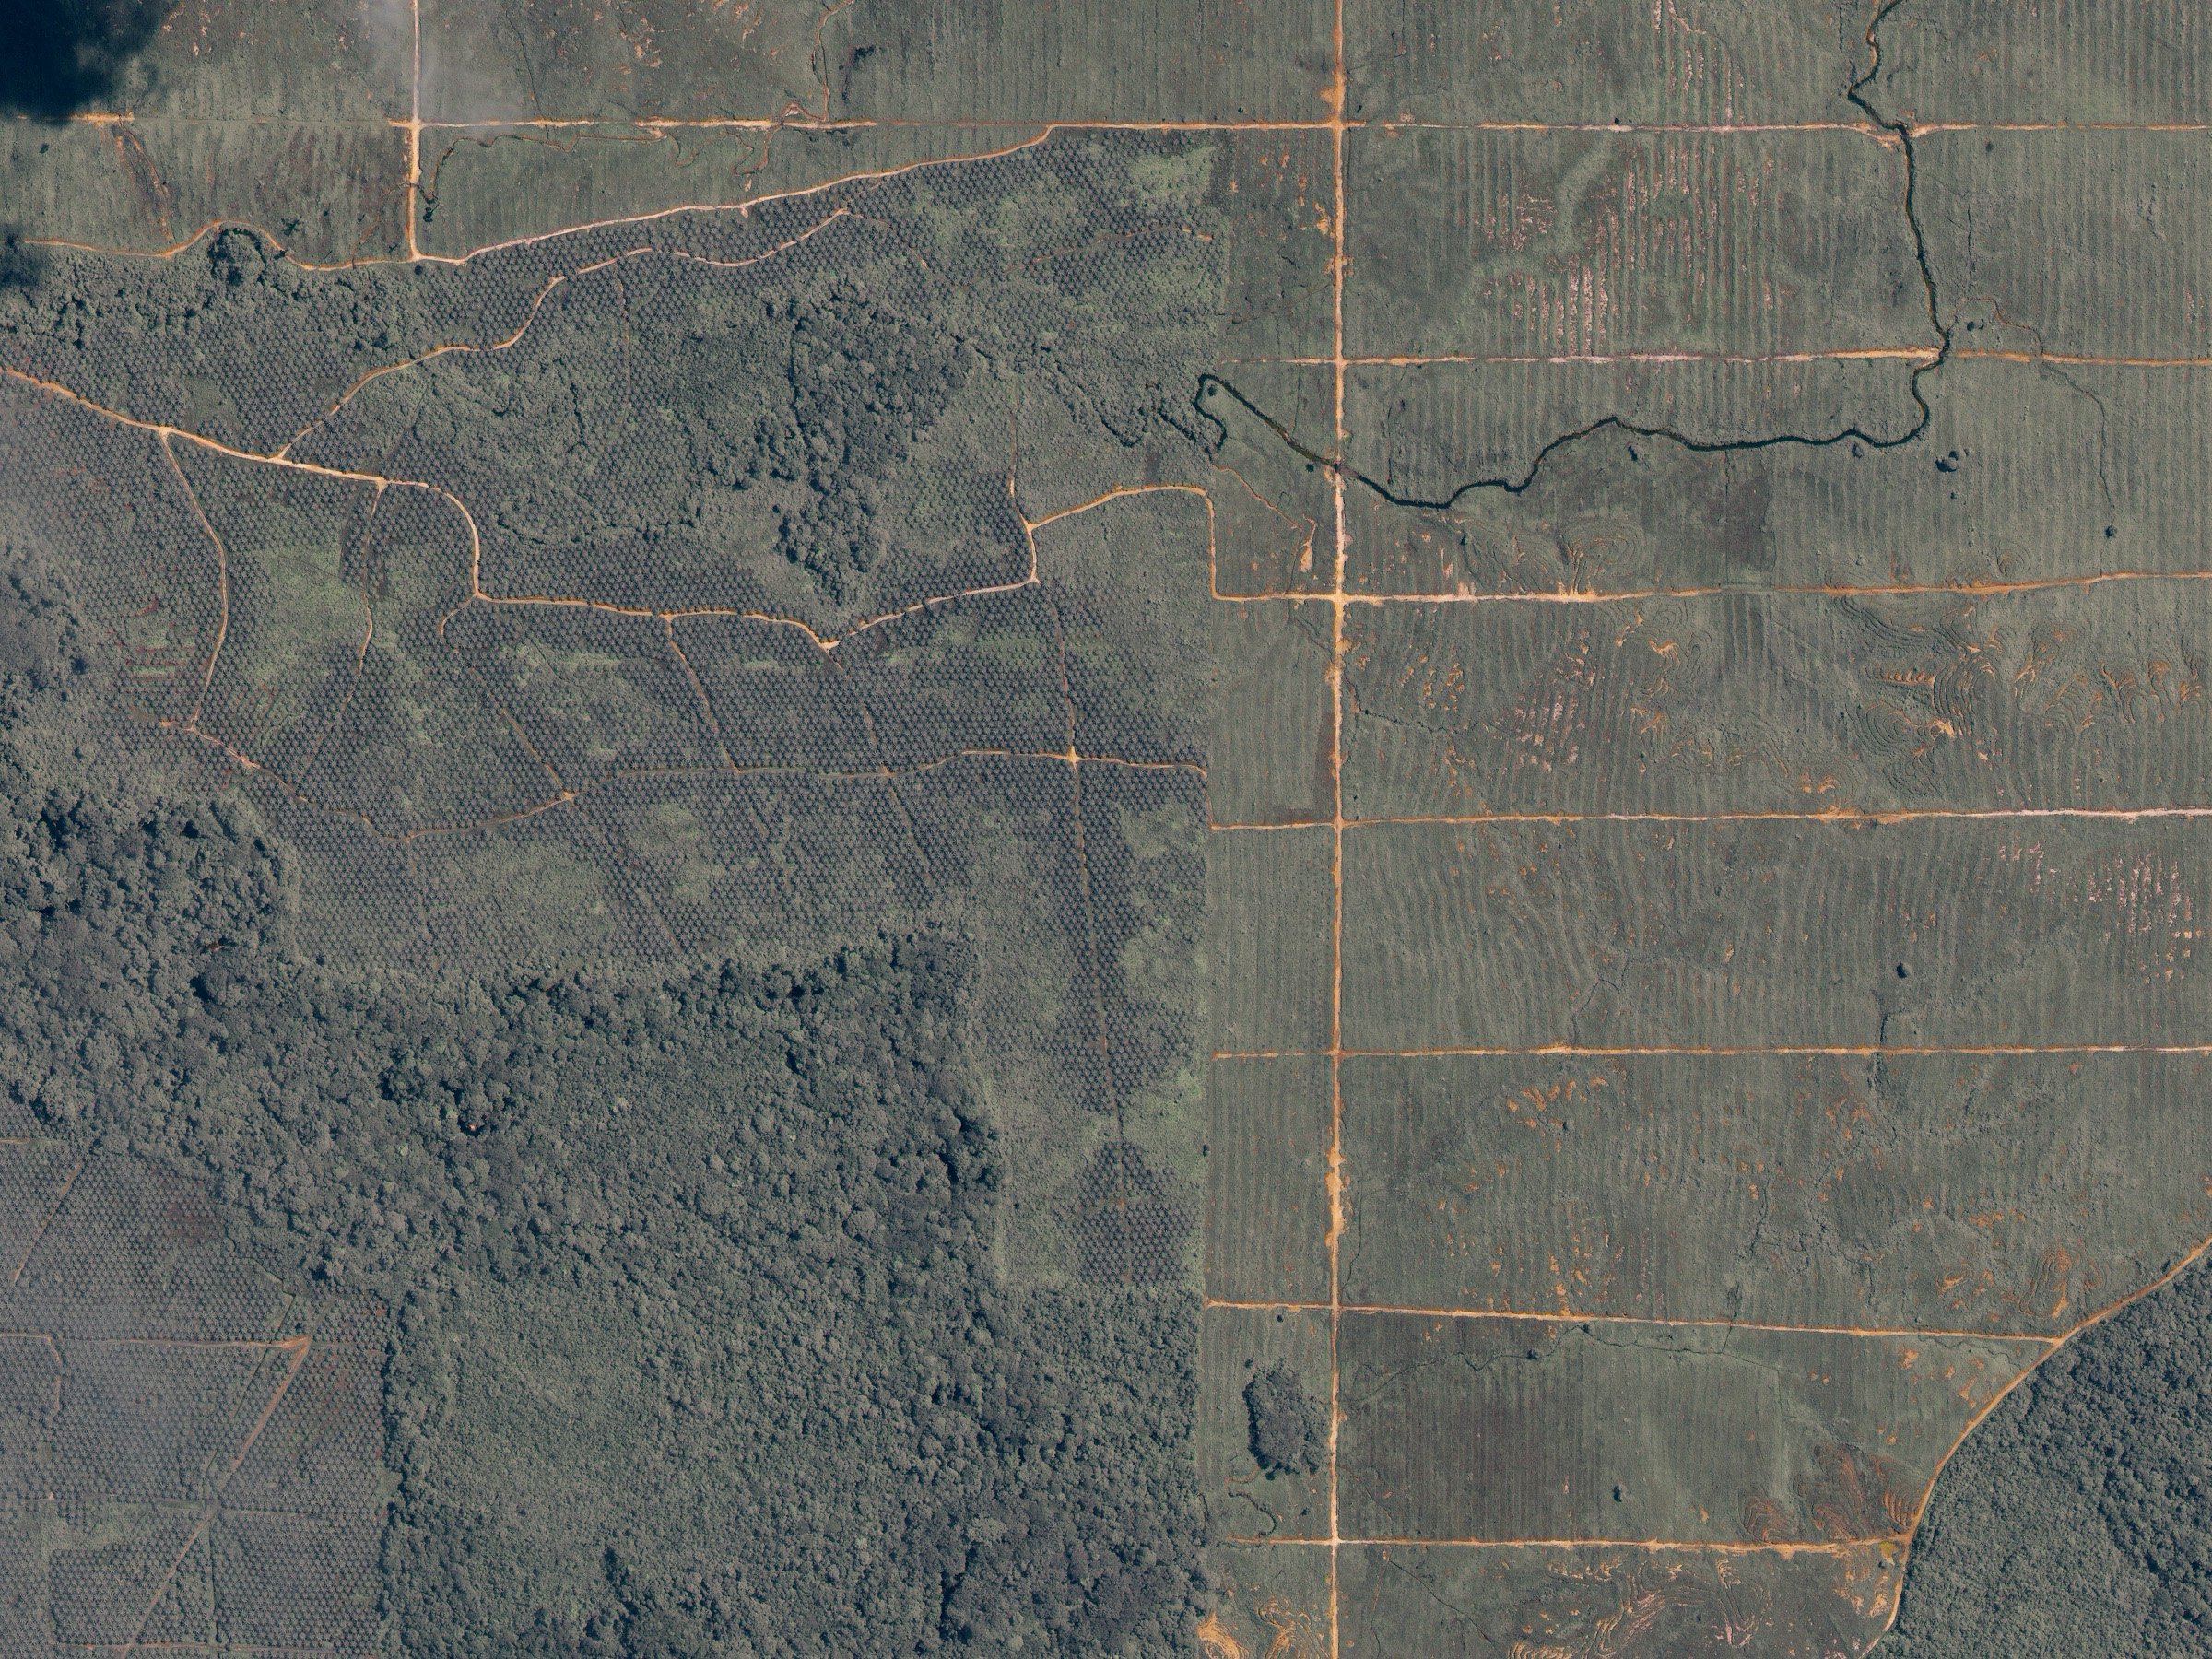
Showing even more detail than Landsat, the commercial Ikonos satellite captured the bottom image on June 18, 2002. The image is natural color, similar to what the human eye would see, with a resolution of one meter per pixel. Spanning about 720 meters, this image covers the rectangular area outlined in white in the Landsat image above. This image shows land use differences along the plantation’s edge: forest, cleared land, palm plantation, and access roads. Compared to the untamed forest, the honeycomb-patterned palm plantation has much sparser vegetation. Detailed images like the Ikonos image show land use on a field-by-field basis.
NASA Landsat image by Jesse Allen and Robert Simmon. Ikonos image ©2003 GeoEye. Caption by Michon Scott and Holli Riebeek.
© All Rights Reserved: Use of IKONOS, GeoEye, QuickBird and WorldView imagery must be coordinated with Maxar.