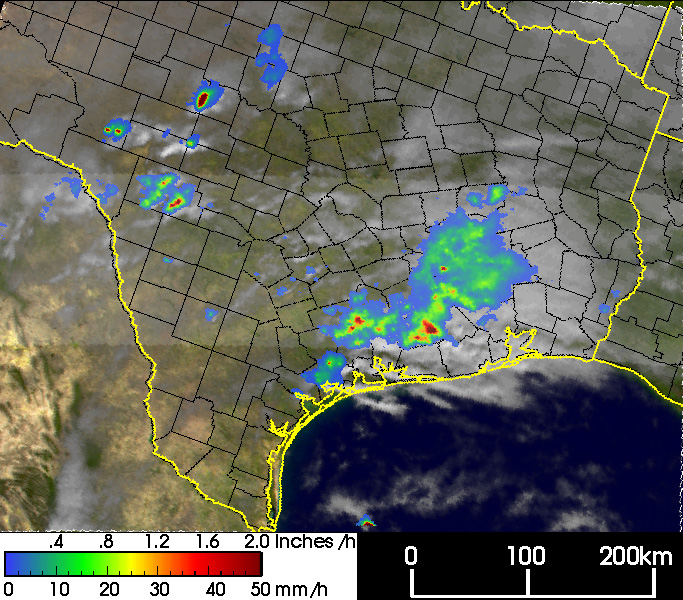
An advancing frontal system brought heavy rains to much of the southeastern United States. Among the hardest hit regions were the Mississippi Valley and the northern Gulf Coast. Low pressure over the central plains tapped into abundant moisture from the Gulf of Mexico to produce numerous storms ahead of an advancing cold front. Southerly winds ahead of the low-pressure system transported warm moist air up from the gulf northward into the Mississippi Valley. Storms that formed within this moist air out ahead of the cold front deposited significant amounts of rain from eastern Texas (shown above) up through the Mississippi Valley and as far east as the Florida panhandle. The continuous regeneration of storms all the way down into the Gulf of Mexico combined with their movement to the northeast led to an effect known as “training,” whereby several consecutive storms pass over the same area. This can lead to significant rainfall accumulations over a span of days.
The Tropical Rainfall Measuring Mission (TRMM) satellite took this first image of a cluster of storms as they were approaching Houston, Texas. The image was acquired at 15:50 UTC (9:50 a.m. CST) on November 17, 2003. The false-color image shows rainfall rates measured by the TRMM Precipitation Radar (PR), in the inner swath, combined with data from the TRMM Microwave Imager (TMI), in the outer swath, all overlaid on visible data from the TRMM Visible Infrared Scanner (VIRS) in white. Areas of heavy rainfall (red areas) associated with convective storms are embedded within areas of moderate (green areas) to light rain (blue areas).
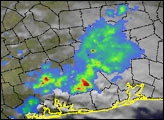
Using the TRMM Precipitation Radar data, scientists also produced a detailed three-dimensional look at the internal structure of the stormclouds over Houston. In that movie, the colors represent the storm’s intensity, indicated by the size and concentration of water and ice particles within the cloud. As the colors graduate from blue to green to yellow and finally red, they show how high the updrafting air currents lofted the stormcloud’s water and ice particles. In short, the colors correspond to rain rate, with red being high, yellow intermediate, and blue relatively low.
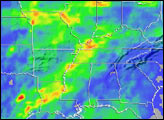
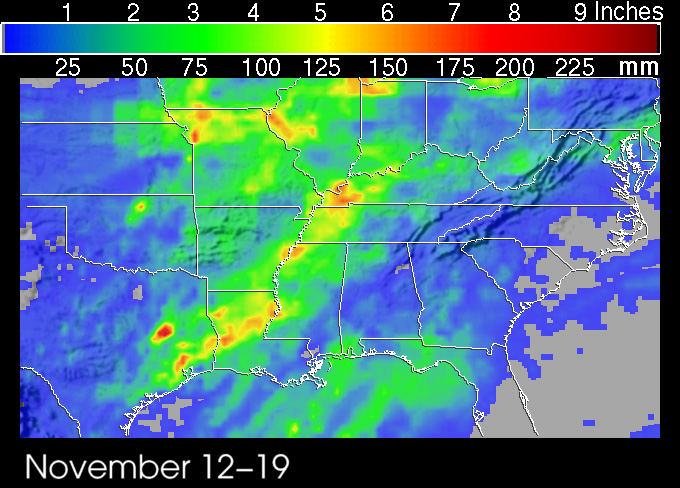
A subsequent TRMM image shows a composite map of rainfall totals across much of the southeastern United States for the period November 12-19, 2003. This image was prepared by the TRMM-based, near-real-time Multi-satellite Precipitation Analysis (MPA) team at NASA’s Goddard Space Flight Center. The composite image reveals a swath of moderate rainfall (green region) extending from East Texas across Louisiana up through the Mississippi Valley and into the Ohio Valley, with locally heavier amounts of near 8 inches (in red). A similar pattern of rainfall extends back into western Missouri and into northeastern Illinois. The system also brought moderate amounts of rain across the Gulf Coast region from southern Mississippi across the Florida panhandle. This time-series animation shows the locations and rates of rainfall across the southeast from November 12-19, 2003.
TRMM is a joint mission between NASA and the Japanese space agency, NASDA. Visit the TRMM Web site for more details and more images from the mission.
Images and animations courtesy Hal Pierce, and caption by Steve Lang, both of SSAI/NASA GSFC


