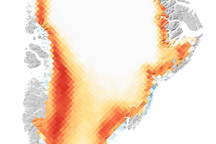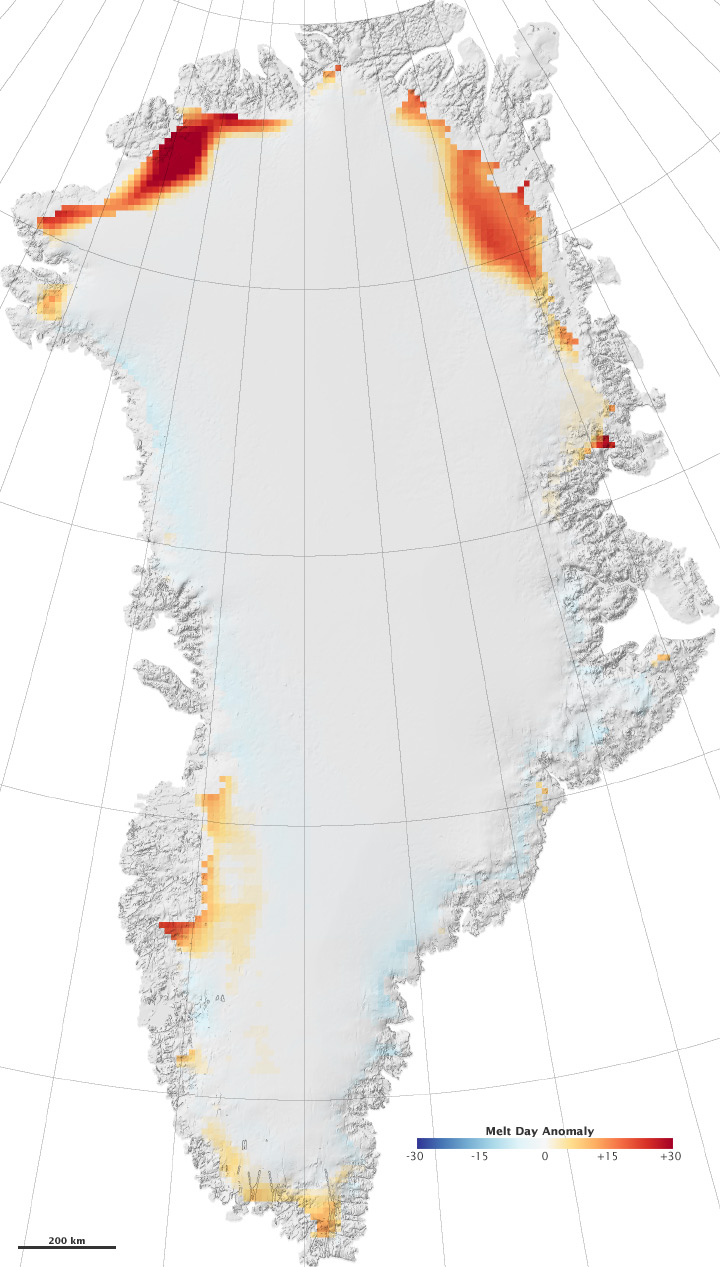
The northern fringes of Greenland’s ice sheet experienced extreme melting in 2008, according to NASA scientist Marco Tedesco and his colleagues. This image shows the number of days when melting occurred on the ice sheet compared to the average number of melt days between 1979 and 2007. Red outlines the northern rim and parts of the west coast of Greenland, indicating that the summer melting period in 2008 was longer than average in many places. Many locations in northern Greenland experienced a record number of melt days. Temperatures at nearby ground-based weather stations were correspondingly high. The average temperature between June and August 2008 was as much as 3 degrees Celsius above average, with new record temperatures at many ground-based weather stations.
Tedesco routinely monitors melting on Greenland using satellite-based microwave measurements. Snow and water emit microwave energy, but each has a distinctive signature. If you were able to see microwave energy, it would seem that the snow suddenly shifted color as it began to melt. By using satellites to record the microwave energy coming from the ice sheet, scientists can track water in snow. This image was made with data from the Special Sensor Microwave Imager (SSM/I) on board the F13 satellite of the U.S. Defense Meteorological Satellite Program (DMSP).
Microwave emissions could be used to do more than record melt days. Satellite measurements of microwave energy could also be used to monitor snow accumulation and temperature change in remote snowy regions. “The data have shown great potential for monitoring snow accumulation rates in certain areas of the [Greenland] ice sheet, yet not in others, and so the question of ‘why’ remains,” says Lora Koenig.
A remote-sensing glaciologist, Koenig spent November 2008 through February 2009 at the National Science Foundation’s Greenland Summit Camp research station where she collected ground measurements to better understand microwave emissions of snow and ice. “My measurements will help us better understand the microwave signal [emitted by the ice and measured by satellite-based microwave instruments] and, hopefully in the future, produce more accurate maps of temperature and accumulation changes on the ice sheets.” To read more about Koenig’s experience on the ice, see Winter Camp: A Blog from the Greenland Summit.
Map by Robert Simmon, based on DMSP SSM/I data from Marco Tedesco, City College of New York. Caption by Holli Riebeek.