
Most of the time, a case of Rift Valley fever is a minor thing. For four to seven days, the afflicted person runs a fever with aching muscles, joints, and head. In a very small percentage of cases, the consequences are more serious: blindness, mental impairment, or even death. Both humans and animals are susceptible; in animals, the disease causes abortions and a much higher rate of death. An outbreak of Rift Valley fever can lead to a costly loss of livestock.
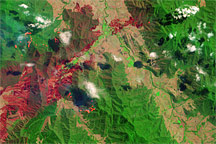
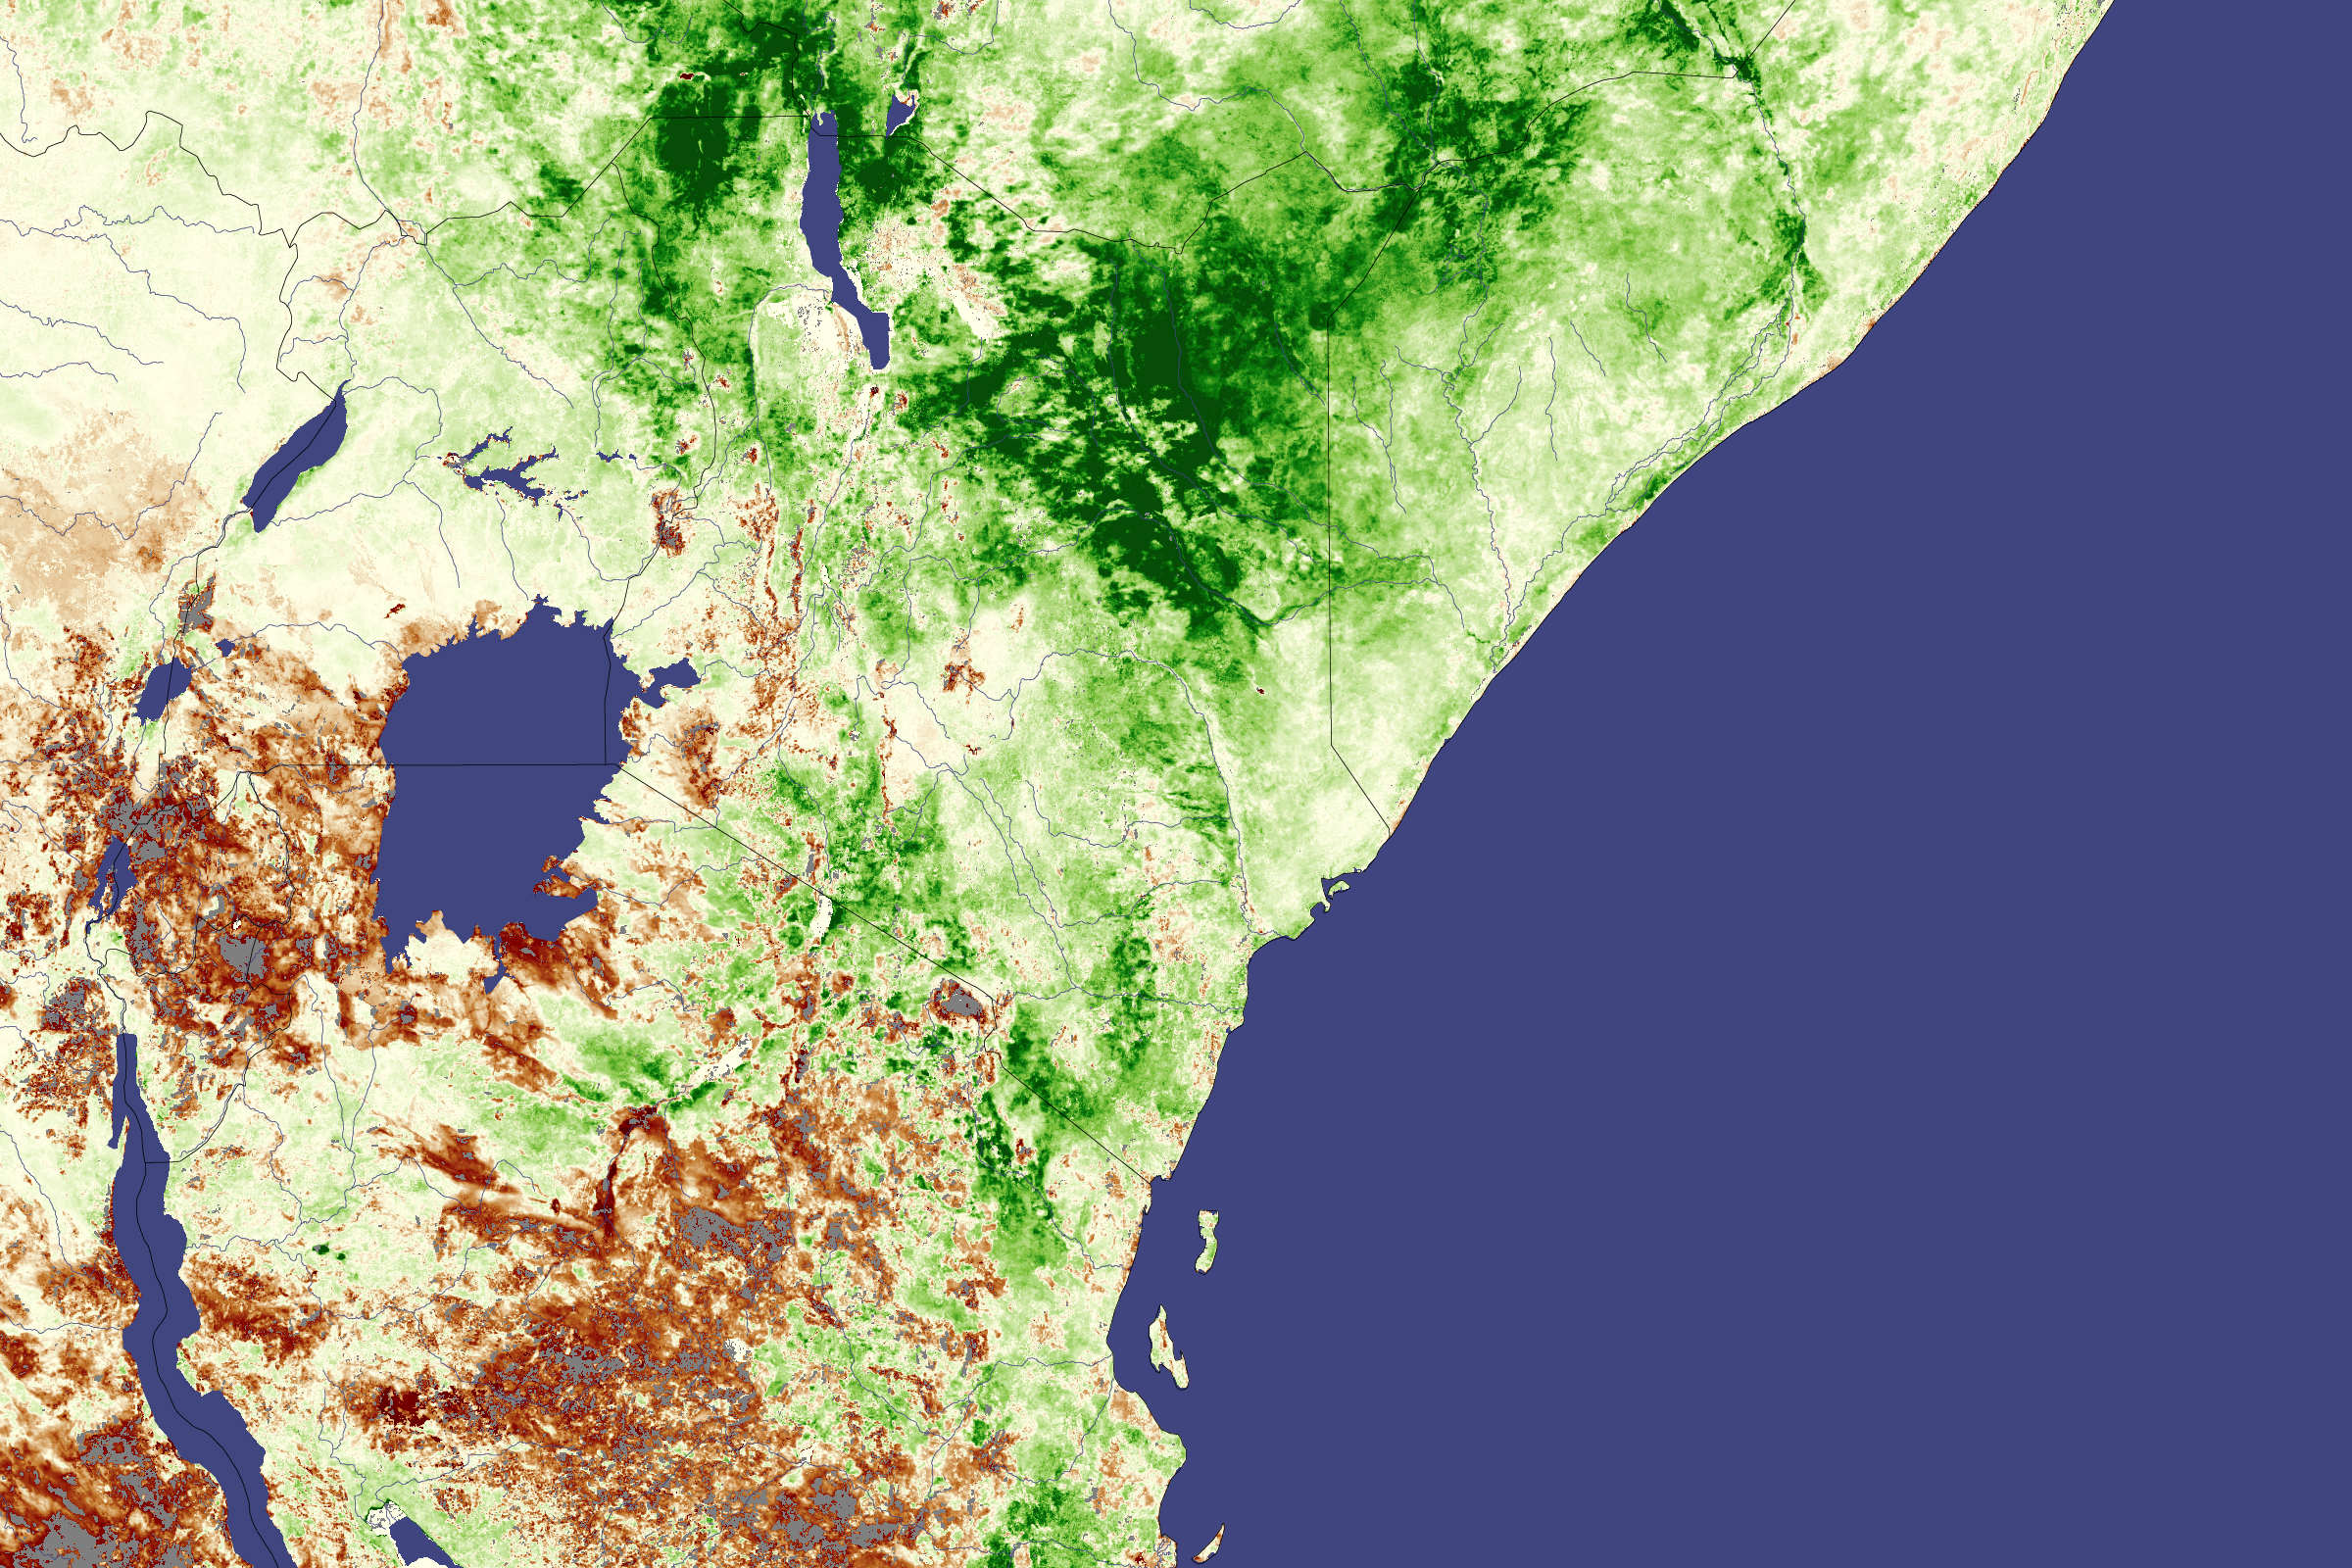
These images illustrate how native Kenyan and NASA-funded scientist Assaf Anyamba and a team of collaborators from NASA Goddard Space Flight Center, the Walter Reed Army Institute of Research, the World Health Organization, the United States Army Medical Research Unit-Kenya, and the United States Department of Agriculture used satellite data to predict an outbreak of Rift Valley fever in late 2006. The top image shows vegetation growth in December 2006 compared to average growth in previous Decembers from 1998 through 2006 as seen by France’s SPOT satellite. Areas where plants were growing far more than average are dark green, while less-than-average growth is represented in brown. This information served as a proxy for the conditions that accompany an outbreak of Rift Valley fever.
Rift Valley fever is initially spread through mosquitoes (though exposure to the blood of an infected animal can also make a person sick). The disease, so far only seen in East Africa, Egypt, and the Arabian Peninsula, breaks out after unusually heavy rainfall. Water pools in low-lying areas, creating the ideal habitat for disease-carrying mosquitoes. The mosquitoes multiply and spread the disease. At the same time, the rainfall also spurs plant growth. Areas that are intensely green in a vegetation index image, such as the image shown above, are also areas that are likely to include good habitat for mosquitoes. These are the areas where a person or animal is most likely to get Rift Valley fever from an infected mosquito.
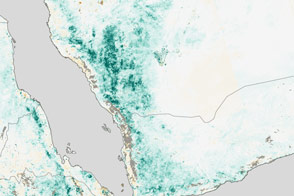
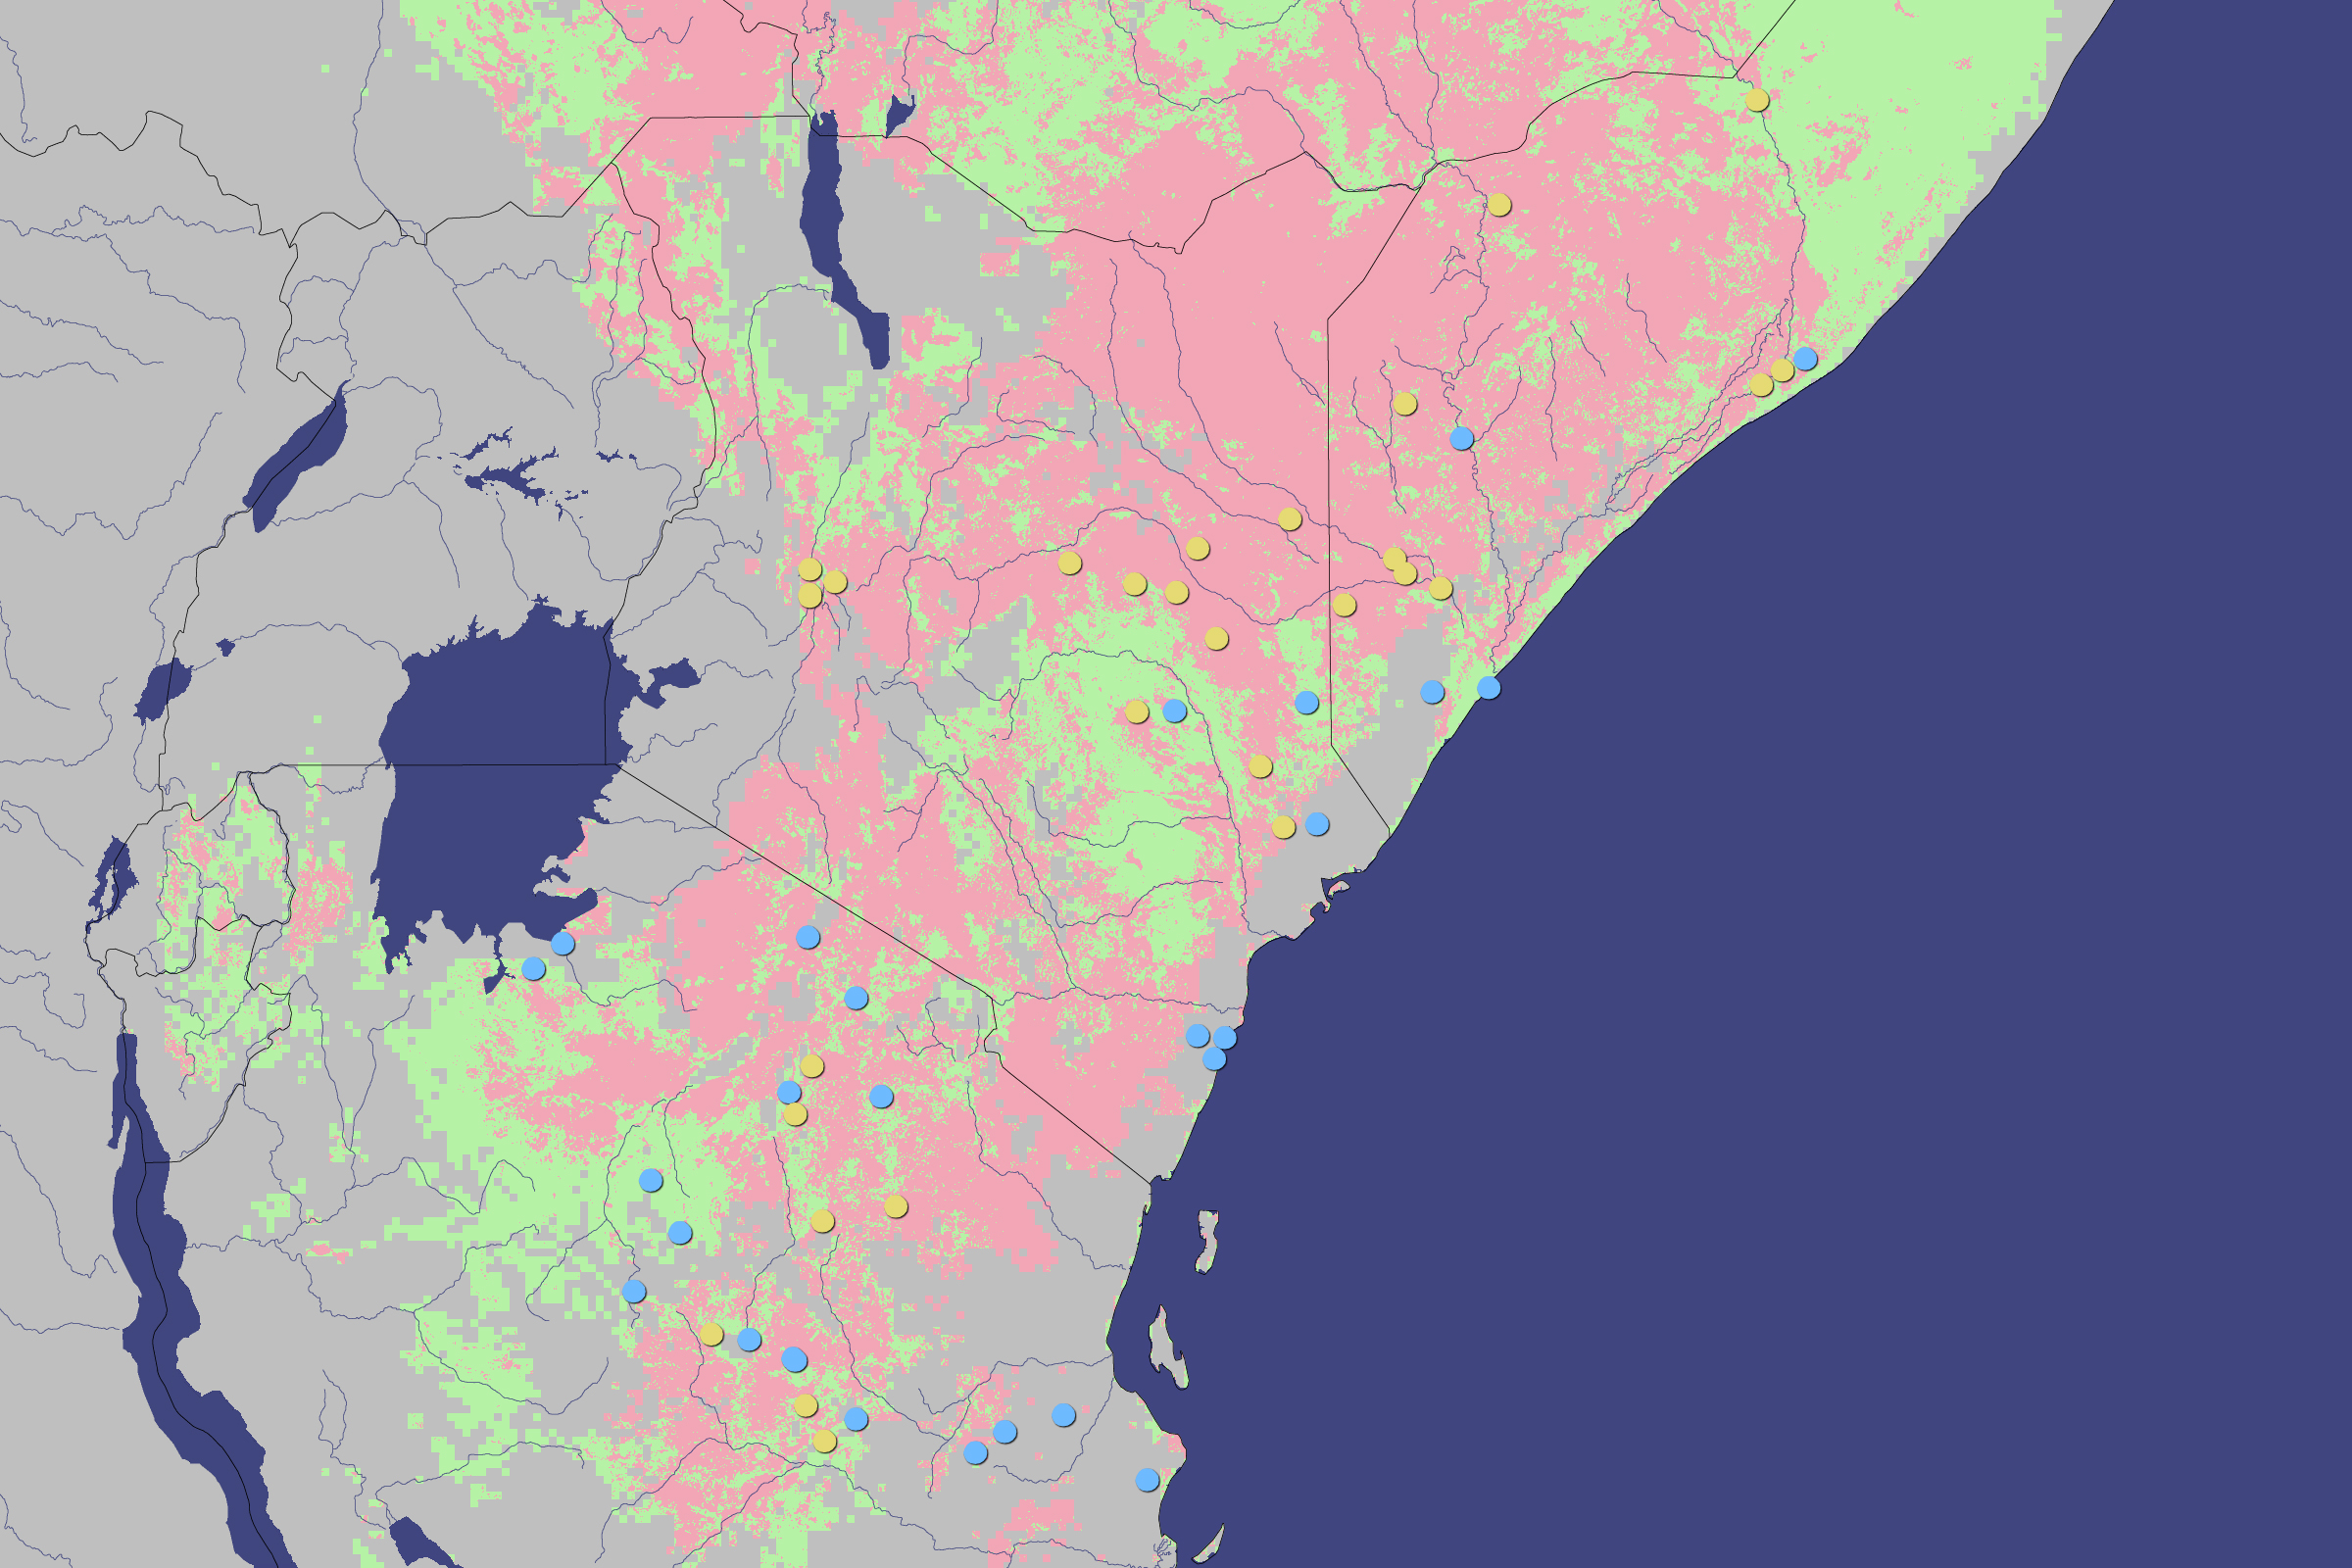
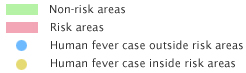
The lower image shows the risk map Anyamba and his colleagues created based on satellite data of rainfall and vegetation. Regions where an outbreak of Rift Valley fever might be expected based on high rainfall and higher-than-average plant growth are red. Adjoining regions, where the disease was less likely to appear based on satellite data, are green. The locations of reported human cases between September 2006 and May 2007 are marked with circles on the risk map. Those cases that fell into the risk area are yellow, while those that fell outside the risk area are blue.
Vegetation is not the only thing that clued Anyamba in to the fact that Rift Valley fever might be brewing in East Africa in late 2006. For the past 60 years, every large outbreak of Rift Valley fever has been associated with El Niño, which warms the eastern Pacific and western Indian Oceans. The change in ocean temperatures is accompanied by a change in rainfall patterns. In East Africa, El Niño brings widespread heavy rain, increasing the chances of Rift Valley fever. Anyamba and his colleagues monitored ocean temperatures, and when an El Niño developed, they started to watch for increased rainfall and vegetation growth in East Africa. In September 2006, the team predicted that Rift Valley fever would break out in East Africa and issued warnings, which allowed governments to prepare. By December, the earliest human cases started to show up in Kenya. The outbreak lasted through February 2007. It was the first time an outbreak of the disease had been accurately predicted.
Their work was published in the Proceedings of the National Academy of Science on January 20, 2009. For more information, see NASA Study Predicted Outbreak of Deadly Virus.
NASA images created by Jesse Allen, using provided by the United State Department of Agriculture Foreign Agriculture Service and processed by Jennifer Small and Assaf Anyamba, NASA GIMMS Group at Goddard Space Flight Center. Caption by Holli Riebeek.