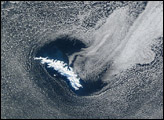
Although Hurricane Hernan did little more than possibly lead to an increase in sick days among California surfers, the storm was the first this year in the eastern Pacific to obtain Category 5 status. Hernan reached its peak intensity on September 1, 2002, just southwest of Baja California, packing sustained winds of 160 miles (260 kilometers) per hour. The storm traveled up the coast of Mexico before turning into a tropical depression on September 5, roughly a thousand miles southwest of Los Angeles. As last reported, the storm was generating sustained winds of 40 miles (65 kilometers) per hour and giving rise to 10 to 15 foot waves along the California coastline.
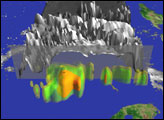
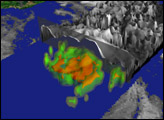
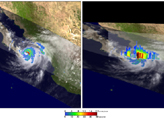
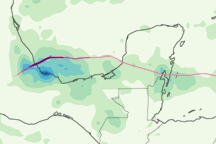
The above image shows the rainfall levels inside the hurricane on September 1. The data were obtained by the Precipitation Radar aboard NASA’s Tropical Rainfall Measuring Mission (TRMM) satellite. The Precipitation Radar bounces radio waves off of clouds to retrieve a reading of the number of large, rain-sized droplets within the clouds. By studying such rainfall data, scientists hope to improve their understanding of the inner workings of hurricanes and thus improve their forecasting abilities. In the image, yellow denotes areas where 0.5 inches of rain is falling per hour, green denotes 1 inch per hour, and red denotes more than 2 inches per hour.
For more images and an animation, visit the Hurricane Hernan page at the SVS.
Image by Lori Perkins, NASA Goddard Space Flight Center Scientific Visualization Studio