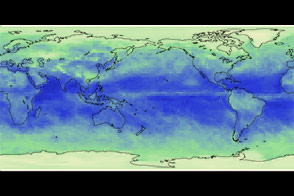
Reflected shortwave radiation (visible light) animation (2 MB)
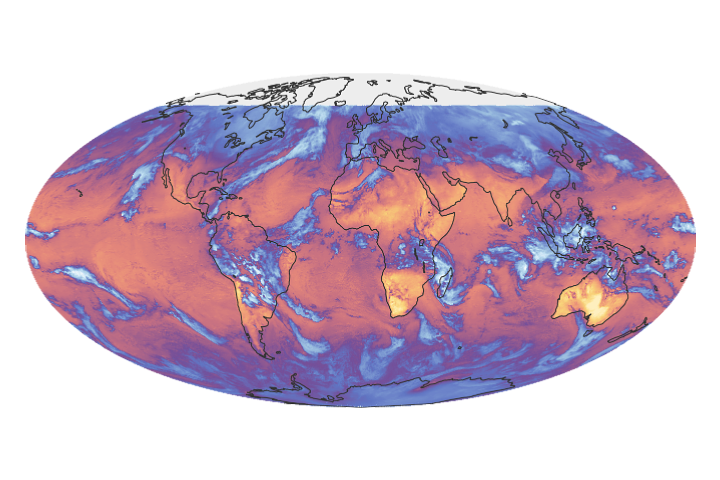
Outgoing longwave radiation (heat) animation (2 MB)
Today (June 21) is the summer solstice, which serves as an annual reminder of just how much our world is driven by sunlight. Days are longer and, with the increased exposure to solar radiation, temperatures are rising in the Northern Hemisphere. This year NASA scientists have a new pair of eyes with which to watch more closely how the sun influences the Earth’s climate system. Two Clouds and the Earth’s Radiant Energy System (CERES) instruments aboard Terra monitor the Earth’s energy balance, giving new insights into climate change.
Earth’s energy balance represents the sum total of all the interactions of radiant energy (both sunlight and heat) with our planet’s climate system. For the first time ever by a space-based sensor, CERES can measure the radiant energy reflected and emitted back into space accurately enough to tell scientists which aspects of the Earth’s climate system—such as clouds, aerosol particles, surface reflectivity—are changing, and exactly how much these changes affect our planet’s total energy budget.
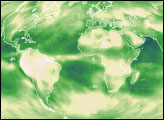
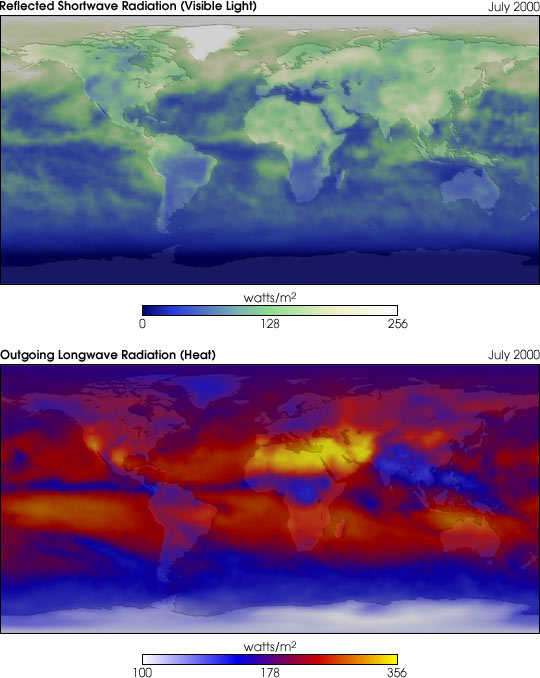
The top image shows the average amount of sunlight (in Watts per square meter) that was reflected from the Earth back into space during a day in July 2000. White pixels show where more sunlight (or reflected shortwave radiation) is escaping the top of the atmosphere. Green pixels show intermediate values and blues show the lowest values. Clouds and snow-covered surfaces are highly reflective, while the ocean strongly absorbs sunlight. Note that Antarctica appears dark because it is night time there in the month of July.
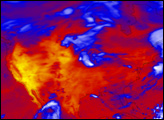
The bottom image shows the average amount of heat (in Watts per square meter) that was emitted from the Earth back into space during a day in July 2000. Yellow pixels show where more heat (or outgoing longwave radiation) is escaping the top of the atmosphere. Purples and blues show intermediate values and white pixels show the lowest values. Desert regions and other areas experiencing heatwaves (i.e., Southwestern U.S.) emit a lot of heat, while the cold cloud tops of the thunderheads along the equator and the snow and ice-covered continent of Antarctica emit very little heat.
Click the animations above to see how our world’s radiant energy fluxes changed over the course of the last 14 months (March 2000 to May 2001). Notice, for example, how the energy seems to shift to the Northern Hemisphere this time of year, and toward the Southern Hemisphere during the summer months there.
Data courtesy Bruce Wielicki and Takmeng Wong, and the CERES Science Team at NASA Langley Research Center; Images courtesy Tom Bridgman, NASA GSFC Scientific Visualization Studio