 |
|||
|
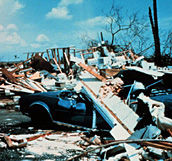
For years, scientists have struggled to understand the inner workings of hurricanes, in short, because they
had no way to get a complete picture of the storm from the top down. Now, by dropping small sensors into
hurricanes from above, scientists are acquiring data at high altitudes that will help them better understand
the structure and dynamics of hurricanes.
|
September 10, 2002
|
||
|
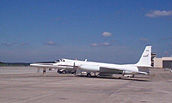
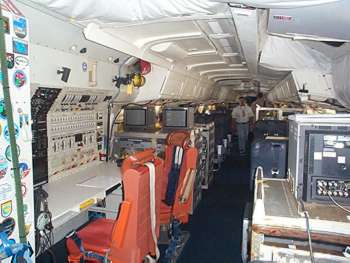
“Historically, getting measurements of the temperature and wind structure in the upper levels of a hurricane has been difficult, if not impossible,” said Gerald Heymsfield, Research Meteorologist at NASA’s Goddard Space Flight Center. “There’s been a lot of speculation about what’s going on up at those high levels, but nobody has been able to take the measurements.” Researchers also need to know what occurs in real time inside a hurricane, according to Jeff Halverson, assistant professor of geography at the University of Maryland/Baltimore County and research scientist at NASA’s Goddard Space Flight Center. “Models that make predictions about hurricanes need real-time observations on which to base a forecast,” said Halverson. “We have to understand the physics better, and then put that information into the forecast models.” Halverson and Heymsfield are participants in a series of hurricane field research investigations, initiated by NASA’s Earth Science Enterprise, called the Convection and Moisture Experiment (CAMEX). The first two missions, conducted in 1993 and 1995, focused on atmospheric and precipitation processes. In 2000, CAMEX-3 turned its attention to the hurricane intensification process and captured an unprecedented look at Hurricane Bonnie’s eyewall — the zone surrounding the eye where surface winds reach their highest speed. (See In the Eyewall of the Storm.) CAMEX-4, conducted in collaboration with the National Oceanic and Atmospheric Administration (NOAA) Hurricane Research Division and the United States Weather Research Program (USWRP) and sponsored by NASA’s Atmospheric Dynamics and Remote Sensing Program, took place during the 2001 hurricane season. Based at the Naval Air Station in Jacksonville, Florida, the CAMEX-4 team embarked on a campaign to study hurricane development, tracking, and landfall impacts. The researchers hoped to gather valuable hurricane data by venturing into a hurricane at high altitudes, but there was just one problem: a shortage of hurricanes in the Atlantic. While the previous few seasons in the Atlantic had produced numerous hurricanes, several of which made landfall, only a few storms occurred in 2001. These were short-lived, and only one made landfall. “It was just one of those dead seasons,” said Halverson. “Then Hurricane Erin came along, and we were like a bunch of little kids dying to get our hands on it because we’d been kicking a can around doing nothing.” With Hurricane Erin, the CAMEX-4 team finally hit pay dirt. On September 8, 2001, Erin, which was churning towards the island of Bermuda, was upgraded from a tropical storm to hurricane status. On September 10, the National Weather Service classified Erin as a Category 3 hurricane, a storm accompanied by winds of up to 130 miles (210 kilometers) per hour. That same morning, the research team, equipped with aircraft from both NASA and NOAA, immediately geared up to fly into the region around Erin’s eye. “NASA has a unique suite of high-altitude aircraft that can get to those upper levels of the hurricane,” said Halverson. “For years, NOAA has been flying planes into hurricanes, but they can’t get much above 18,000 feet, and that’s just a small piece of what the whole storm represents.” NASA’s ER-2, however, is a modified U-2 that can fly at 70,000 to 75,000 feet (21,000 to 23,000 meters). “This is practically outer space. The pilot is actually required to wear a spacesuit,” Halverson said. Key to the mission was a cylindrical instrument called a dropsonde, which measures roughly 3 inches in diameter and 20 inches long (7.6 centimeters in diameter and 51 centimeters long). “This technology has been around for awhile, and it involves launching robot sensors, or dropsondes, from aircraft. These sensors fall to the Earth via parachutes, taking measurements of temperature, pressure, winds, and humidity every half second,” said Halverson. During their descent, the dropsondes transmit the data to the aircraft where they are recorded for later analysis.
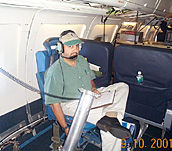
Although dropsondes were deployed during previous CAMEX missions, CAMEX-4 introduced a new dimension to the experiment: for the first time, dropsondes were launched from the ER-2 aircraft at an altitude of 65,000 feet (20,000 meters). During the flight mission over Erin, Halverson was on a NOAA DC-8, situated 30,000 feet (9,100 meters) below the ER-2, telling its pilot where to release the dropsondes. “We had three different layers of aircraft flying through this storm and dropping these little instrument packages from different altitudes, and we managed to get eight of them placed very nicely,” Halverson said.
“These storms can change their structure in a matter of minutes. We’re up there in the thick of things where we can see how the storm structure is unfolding and how it’s changing as we fly through it. You can’t make those observations sitting on the ground relying on a weather satellite.” Another boon for CAMEX-4 was that, for the first time, the entire dropsonde process was automated. “Basically, the pilot pushed a button, and when the light turned green, the dropsondes were released. In prior years, you had to have an operator sitting in front of the onboard computer telling it to pick up the dropsondes, put them in the launch tube, and open up the tube to release them,” said Halverson. Although the release process was fully automated, the timing sometimes got tricky, according to Richard Wohlman, a dropsonde system scientist on the CAMEX-4 mission. “It takes about 20 minutes for the dropsonde to fall to the ocean’s surface. Because of our flying patterns and locations, sometimes we only had six minutes between drop points,” said Wohlman, also a meteorologist at NASA’s Global Hydrology Resource Center. “One of our receivers became inoperative, so we had to be really quick on the preflight and launch procedure so that we wouldn’t miss a drop point. There were a couple of times when it got pretty hectic, but we got the job done.” CAMEX-4 accomplished what no previous hurricane field studies have achieved, according to Halverson. “Nobody has ever collected data from that altitude in a hurricane. Now we have a data set that is very rich, because we have eight vertical profiles through the center of this strong storm, which represents a complete snapshot of the inside of the hurricane,” he said. These new data, according to Halverson, not only promise to help researchers understand the inner workings of a hurricane at high altitudes, but they will also improve future hurricane forecasting. Halverson and his colleagues expect improved hurricane forecasting will offset some of the costs of hurricanes, which cause hundreds of fatalities and billions of dollars in property damage worldwide each year. “The often-repeated statistic is that every mile of U.S. coastline that’s placed under a hurricane warning costs about one million dollars in evacuation expenses,” said Wohlman. “If making forecasts more accurate and timely allows us to cut down that warning time by even 10 miles — that saves a cool $10 million. Not a bad return on the investment, I’d say.” Murphy, Brendan, and Damian Nance. 1999. Earth Science Today. Brooks/Cole Publishing Company. NASA looks a hurricane’s temperature in the eye. April 30, 2002. Goddard Space Flight Center. Accessed August 8, 2002. NASA study to brave storms in quest for better prediction, understanding of hurricanes. August 13, 2001. NASA News Release. Seeking a better understanding of hurricanes: NASA Marshall’s Role in the CAMEX hurricane study. August 2001. NASA Facts. |
|||