Look at natural–color satellite images and it becomes clear that most of the water on Earth (about 97 percent) is stored in the oceans. Next you might notice some on the land: liquid water fills lakes and rivers, while frozen water blankets the poles and mountaintops. In the atmosphere, water is visible in the countless tiny droplets that compose the clouds, though there is plenty of moisture even in cloud-free skies.
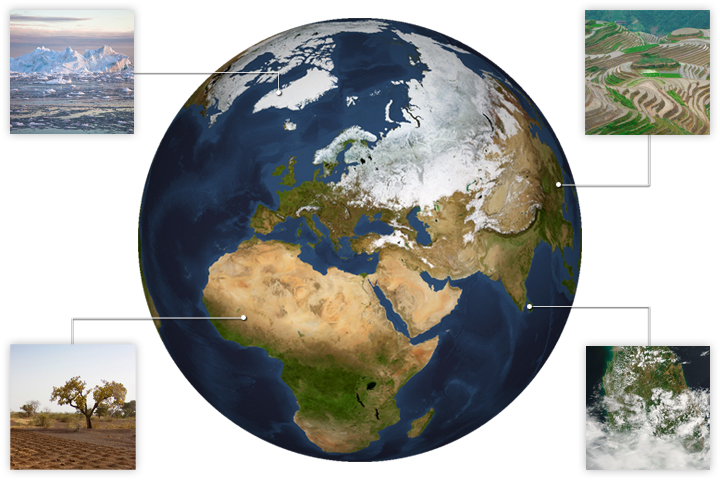
Soil moisture has many expressions and influences in Earth's climate, from evaporation to freezing and thawing ice to droughts and floods. (Photos used under a Creative Commons license, courtesy of Guido Appenzeller (top left), TREEAID (bottom left), and Mike Rosenberg (top right). NASA Earth Observatory image (bottom right) by Joshua Stevens, using Landsat data from the U.S. Geological Survey.)
Not immediately visible, however, is the water residing in the soil. This water does not appear brilliantly blue or white, like the oceans or ice. In fact, it is hard to spot in natural-color satellite images.
Compared to the amount of water stored elsewhere on the planet, the amount in the soil is minuscule. But that small volume has great significance. It can affect when, where, and what a farmer will plant. It can influence the weather. And at high northern latitudes, soil moisture has serious implications for global climate.
For all of these reasons, researchers have developed satellite instruments to measure the water hidden between soil particles. The instruments are either active or passive.
Active radar sensors transmit microwave radiation toward the ground and measure the echoes. Depending on the moisture content, the reflected signal will “look” different—information scientists then use to derive the amount of soil moisture. (One such sensor flies on the Metop satellites operated by the European Organization for the Exploitation of Meteorological Satellites.) The radar approach allows scientists to measure moisture in very specific areas (high resolution), but it is less accurate than other approaches.
Soil moisture can be detected from space by either passive or active satellite sensors. (NASA Earth Observatory illustration by Joshua Stevens.)
"Passive radiometers detect microwave wavelengths of light that are naturally emitted by the soil. Because the signal varies with wetness, scientists can use the information to estimate the amount of moisture in the top few inches of soil. These measurements give better estimates of the amount of water, but over a broader area (coarse spatial resolution) than active radar. The European Space Agency has flown a passive radiometer on the Soil Moisture and Ocean Salinity (SMOS) mission since 2009, and NASA put them on the Aqua (2002) and Aquarius (2011) satellites. NASA’s Soil Moisture Active Passive (SMAP) satellite was launched in January 2015 and carries both a radiometer and radar. However, the radar stopped transmitting data a few months after launch.
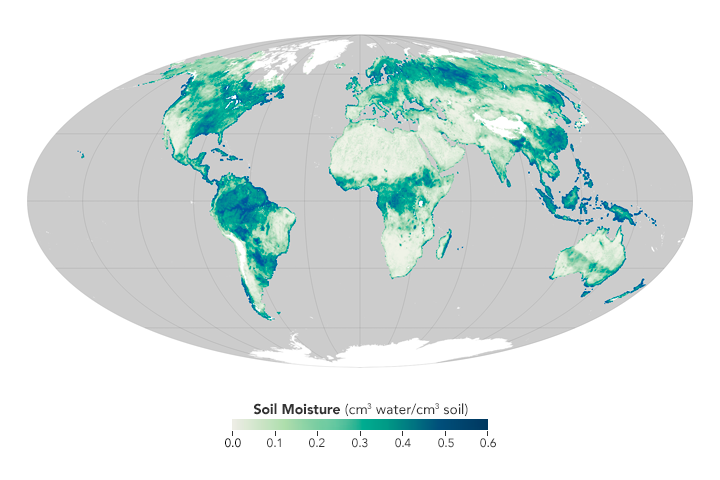
The Soil Moisture Active Passive (SMAP) satellite can observe global soil moisture daily at a 36-kilometer resolution. (NASA Earth Observatory map by Joshua Stevens, using data courtesy of JPL and the SMAP science team.)
All of these platforms, combined with insights from ground-based sensors, contribute to a growing record of global soil moisture. The goal is to establish a standardized set of measurements for the entire planet so that everyone from meteorologists to climate modelers can track the movement of this small but vital reservoir of water.
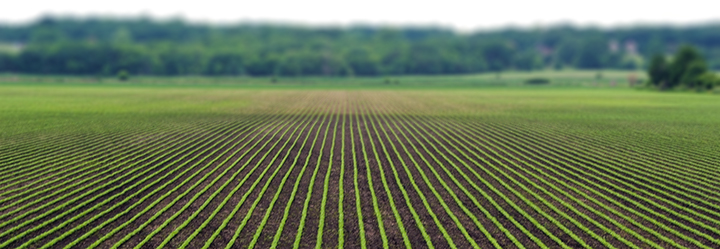
Crops need moisture. But too much rain, or too little, can put crops in jeopardy. (Photo by Carl Wycoff, adapted under a Creative Commons license.)
The most obvious users of soil moisture data are farmers and ranchers. There’s more to it, however, than the simple fact that plants need water to grow. Knowing something about the moisture in the soil is important before, during, and after the growing season. For example, will mud prevent a tractor from safely driving across the fields? How much water will fruits, nuts, and vegetables have available at each stage of growth, from germination through harvest? What is the forecast for crop yields around the world? How will the amount of moisture and agricultural output affect trade policy and food aid?
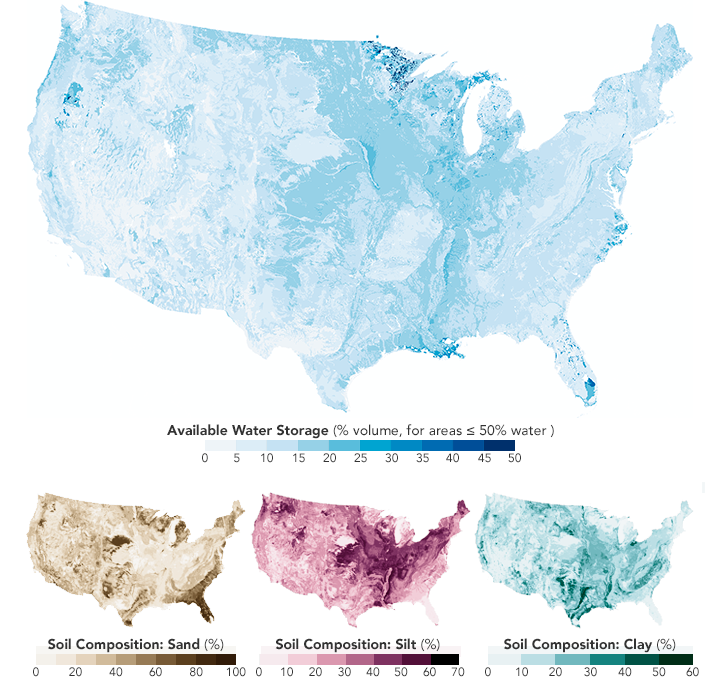
Soils with very small particles, such as clay and silt, are able to hold more water than soils with large particles, like sand and gravel. The composition of soil varies across the United States (above) and around the planet. (NASA Earth Observatory maps by Joshua Stevens, using data from the CONUS-SOIL database.)
Ground-based sensors can monitor soil moisture over small areas, typically less than one square meter. To find out what is happening over larger areas, researchers in several U.S. states have patched together a network of sensors. In Oklahoma, for example, a network to monitor weather and climate parameters (including soil moisture) was conceived after a disastrous flood struck Tulsa in 1984. Interest in this type of network for agricultural purposes also arose in Stillwater. The result was an environmental monitoring network called Mesonet, which in 1996 started to include soil moisture sensors.
Today, more than 100 stations across Oklahoma are making measurements at various soil depths down to 60 centimeters (24 inches). Sensors record the temperature during and after a imparting a pulse of heat; the amount of water in the soil can then be inferred from the temperature change. (Other ground-based methods involve neutron scattering or soil coring.) Data from these sensors, updated every 30 minutes, can help farmers quickly figure out where there is inadequate moisture in their fields.
Mesonet is just one of 31 networks and 1,479 stations in North America. But, in situ networks do not cover all areas of the United States, and certainly not the planet.
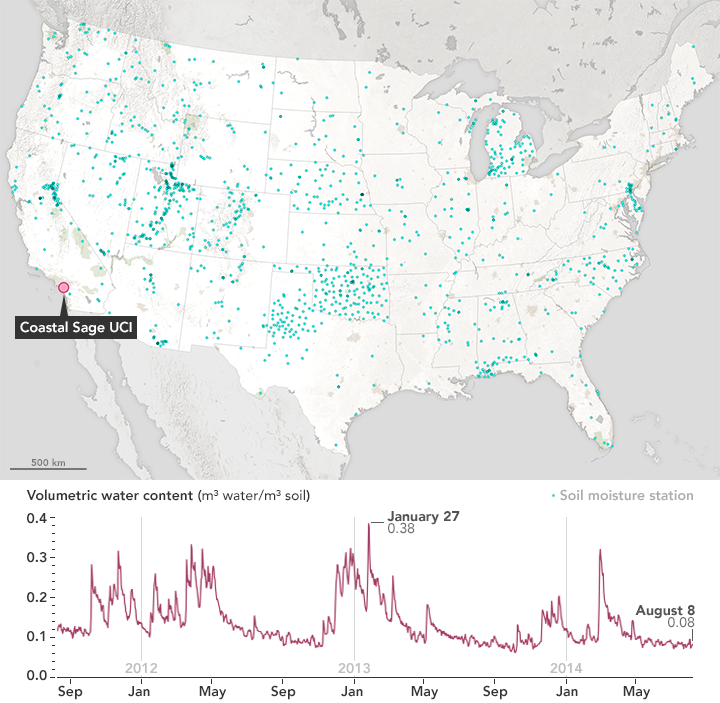
Nearly 1,500 stations track soil moisture in locations across the United States. As an example, the plot shows data from the Coastal Sage UCI station (California). As the map shows, the network is relatively sparse for the size of the nation. (NASA Earth Observatory map and chart by Joshua Stevens, using data from the TAMU North American Soil Moisture Database.)
To fill in the gaps, some scientists estimate global soil moisture by running computer models loaded with precipitation, temperature, and humidity data. Gathering all of the data to run such models can take as long as two to three months, which makes real-time applications impossible.
“What we really want is soil moisture information that can be used to understand how plants are growing and what’s going on in the atmosphere right now,” said Susan Moran, a hydrologist with USDA’s Agricultural Research Service and chair of the SMAP Applications Working Group. “We have to get soil moisture information to the agriculture community, and the only way to do that is from satellites.”
With the recent satellite missions, Moran and colleagues have been learning more about how soil moisture affects plant growth and agricultural productivity, especially during conditions of water shortage and drought. For instance, she notes there have been drier and longer droughts than the one currently parching the western U.S., but none that have been so hot. The combination of heat and the lack of water is driving soil moisture to unprecedented deficits.
“Data from SMAP will make a giant difference for my work,” she said. “We have already looked at five years of data from SMOS; add SMAP onto that and we begin to get a good time series of global soil moisture to help us figure out where vegetation has a high risk of mortality.”
Soil moisture has an obvious, visible effect on the landscape. The high-profile examples are droughts and floods. But the water in the soil has a more subtle, yet equally important role in day-to-day weather.
Soil moisture forms a vast, thin, and mostly out-of-sight reservoir of water that accumulates in the root zone of plants. The water is released to the atmosphere through evaporation and plant transpiration. Averaged globally, this evapotranspiration contributes to more than 60 percent of the precipitation that falls over land each year.
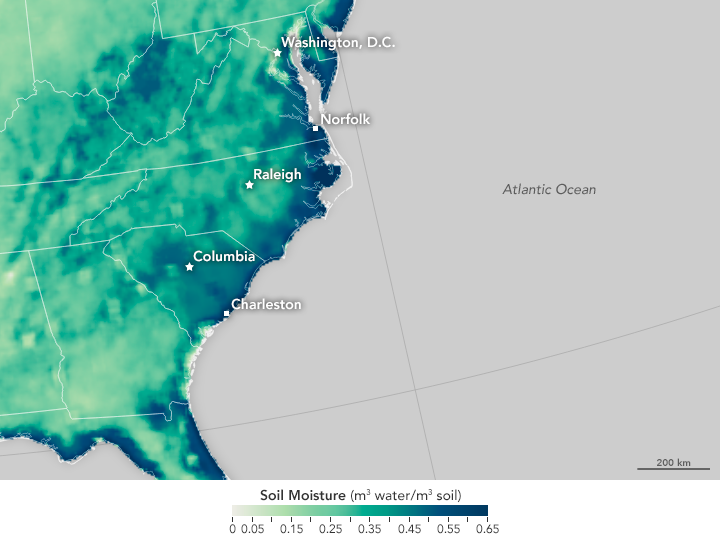
Today, satellites can measure soil moisture globally and quickly. Saturated soils in the map above—measured by SMAP on October 5, 2015—were the result of intense rains that caused flooding in the southeastern United States. (NASA Earth Observatory map by Joshua Stevens, using soil moisture data courtesy of JPL and the SMAP science team.)
“The first time we were struck by the importance of soil moisture for weather forecasts was in July 1993,” said Patricia de Rosnay, a researcher at the European Centre for Medium-Range Weather Forecasts (ECMWF). During the first six months of that year, extreme amounts of rain and snow fell on the central United States. Yet the existing weather models were not accounting for the storage and evaporation of all of that water. They could not see how the water on the land was feeding back into the weather patterns to make the deluge more extreme. By July 1993, the Upper Mississippi River faced its worst flooding on record.
July 1993 also happened to be the same month that ECMWF scientists began testing a new weather forecast model. Their model accounted for soil moisture in the root zone, allowing researchers to see how the soil sustained a high level of evaporation and fed the extreme rainfall event. The new model had produced a closer representation of reality.
The strength of the connection between soil moisture and the weather is not the same everywhere. According to NASA scientist Randy Koster, there are hot spots—about 10 percent of Earth’s surface where the amount of soil moisture plays a more critical role in the weather.
Water that evaporates from Earth’s surface is linked to the formation of clouds and rainfall. In dry areas, variations in the amount of evaporation are too small to have much of an effect on the atmosphere. In humid regions, particularly the tropics, changes in soil moisture do not matter much for evaporation because it is limited by the amount of water that the atmosphere can hold.
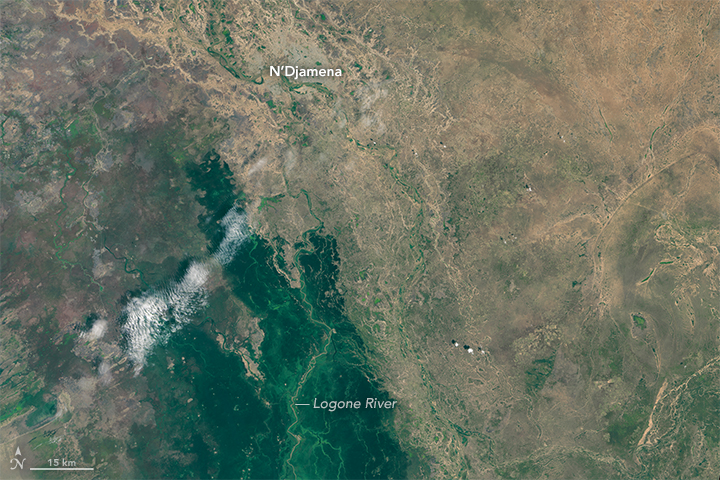
Landsat 8 acquired this image N'Djamena, Chad, on October 20, 2015. The city sits along the Logone River and within the African Sahel. As pictured here after the rainy season, the river's saturated banks are surrounded by a dry, sandy landscape. (NASA Earth Observatory image by Joshua Stevens, using Landsat data from the U.S. Geological Survey.)
The soil moisture hot spots are areas that are neither too dry nor too wet. They are located in the transition zones between dry and wet areas—places that have suitably high evaporation that is more dependent on moisture on the ground than in the atmosphere. The Midwestern United States is one of those hot spots. So, too, are northern India and the African Sahel.
Better estimates of soil moisture in weather models will not necessarily make for perfect long-range forecasts. Randomness in the variables that cause weather will always hinder the accuracy beyond a few days. But with better information on the thin reservoir in the soil, forecasters can tip the scales further in favor of getting weather prediction right.
In the planet’s highest northern latitudes, even the water in the soil is locked away as ice, making it mostly inaccessible to plants. But just a short distance to the south, in the boreal areas of Alaska, Canada, Siberia, and Scandinavia, the landscape comes alive each year after the spring thaw.
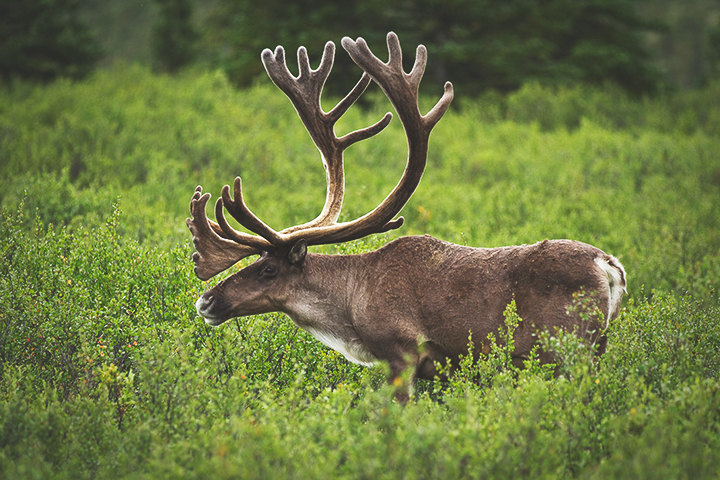
Snow and ice give way to vegetation, signaling the return of the spring thaw—and grazing wildlife. Photo by Jacob W. Frank/NPS.
The transition is relatively rapid, occurring over just a few weeks, and coincides with increasing sunlight and spring snowmelt. Rapid warming releases liquid water. As liquid water becomes more readily available, plant and animal activity are energized. The land greens up, and animals return to graze.
“I’m always impressed by how rapidly northern landscapes transition from frozen and dormant conditions in the winter to a rapid burst of life and activity in the spring,” said John Kimball, a scientist at the University of Montana.
The transition between frozen and thawed land is something researchers have observed for more than 30 years with satellites. The Nimbus-7 Pathfinder, the Defense Meteorological Satellite Program (DMSP) satellites, and Aqua all have carried passive microwave radiometers. They detect the microwave energy coming from the Earth’s surface, which will have different characteristics depending on whether the soil is frozen or thawed. When surface water and soil moisture is locked away as ice, this frozen landscape looks like a desert to a microwave sensor. Thawed landscapes look comparatively wet, so this large contrast is the basis for something called a freeze-thaw measurement.
Across a year, the ice and frozen lands advance and retreat in the high northern and southern latitudes. (NASA Earth Observatory image by Joshua Stevens, using NASA's Blue Marble data.)
Kimball and colleagues have mined 30 years of freeze-thaw patterns from the satellite record. In a paper published in 2012, the researchers showed that soils in the Northern Hemisphere thawed for as many as 7.5 days more in 2008 than they did in 1979. The change was primarily driven by an earlier start to the spring thaw and coincided with measureable warming in the region.
“This was a real eye-opener to me,” Kimball said. “We found that the earlier spring-thaw was driving widespread increases in northern growing seasons.” The start and the length of the growing season have implications for how much carbon is exchanged between the land and atmosphere.
Each year, half of all global carbon emissions are removed from the atmosphere by natural processes on the surface. It is sequestered somewhere on land, and a large amount of that carbon is stored at high latitudes. According to scientists at the Woods Hole Research Center, the boreal region covers about 15 percent of the global land surface, yet holds more than 30 percent of all carbon contained on land.
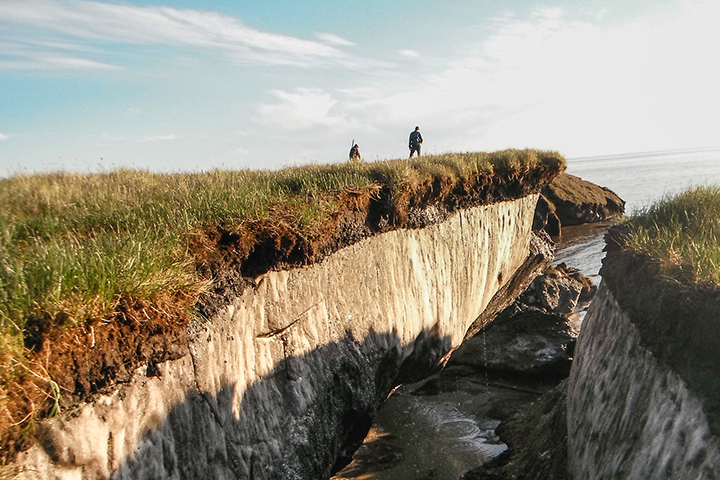
Coastal erosion reveals the extent of ice-rich permafrost underlying the active layer on the Arctic Coastal Plain in Alaska. (Photo by Brandt Meixell/USGS.)
A longer growing season in the north could make vegetation a more important “sink,” removing carbon dioxide from the atmosphere and storing it in forest biomass, dead organic matter, and the soil. But those boreal lands also could become a carbon source though burning, decay, and thawing soil. Currently, the region is thought by many to be a net sink, absorbing more carbon than it releases. But how might thawing soils affect that balance?
The answer is complicated by the fact that the timing of the thaw can vary dramatically over a small area. Sunlight sweeps over the landscape at a low angle, so areas with even the slightest rolling topography can be cast in either shade or sunlight. South-facing slopes thaw first. And just a few extra weeks of thawing time can have a huge impact on plant growth.
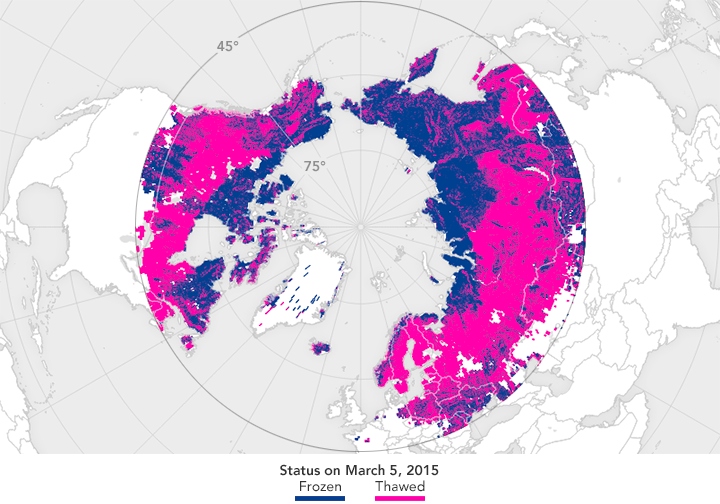
Frozen water forms crystalline structures that can be detected by the radar instrument aboard the SMAP satellite. The map above depicts the freeze-thaw status of areas above 45° N. NASA Earth Observatory map by Joshua Stevens, using data courtesy of JPL and the SMAP science team.
Another complication in the carbon equation is permafrost. Even where the top layer of soil has thawed, there is often a long-term frozen layer below. This frozen layer locks up carbon so that it cannot decompose. But as seasonal thaws reach greater soil depths, more organic matter can decompose and get flushed out into the atmosphere by streams or degassing into the atmosphere. “There is debate as to how stable that soil will be with continued global warming,” Kimball says.
But progress is being made. Freeze-thaw monitoring, according to Kimball, has made a major advance thanks to the development of well-calibrated, long-term satellite soil moisture records. As those observations continue, and as they encompass more of the planet, it stands to reason that our understanding of the entire water cycle will improve.
