For a short time after a snowfall, glaciers are like blank white canvases. But it’s not long before the snowy surfaces are painted over with coats of dust, soot, ash, pollen, salt, sand, rocks, and other debris.
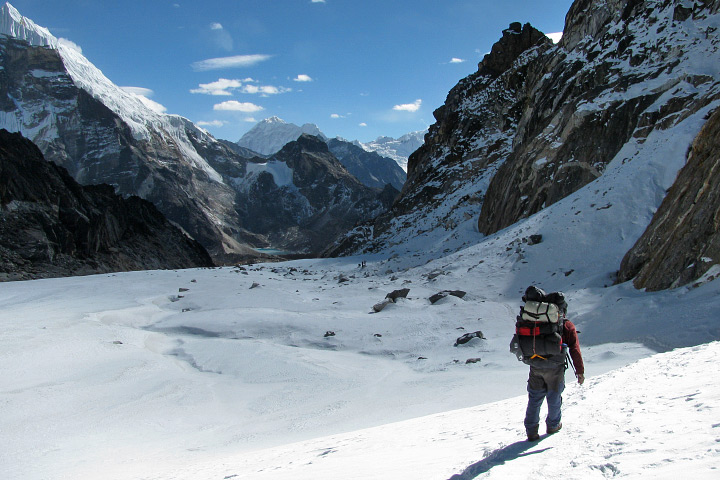
Bright white snow fills Cho La pass, which separates Ngozumpa Glacier from Khumbu Glacier and Everest Base Camp in Nepal. (Photograph ©2009 Kimberly Casey.)
Nature has more than one paintbrush at its disposal. Winds blow in plumes of smoke and dust to coat surfaces with black, gray, metallic, even reddish or yellow tones. Volcanoes spew dark ash and tephra that can be millimeters to meters thick. And landslides and lahars slosh thick layers of soil, pulverized rock, muck, and sediment on the icy canvases.
This natural painting is an apt metaphor for the work of Kimberly Casey, a NASA glaciologist who once considered becoming an artist. After high school, she had scholarships for both science and art; she chose the former, but her artistic side has not disappeared. She continues to paint, draw, and take photographs, and those artistic skills and interests overlap with the ones she uses to explore new ground as a scientist. Casey is fascinated by the way the human eye perceives reality, and also intrigued by the deeper, hidden layers of meaning embedded in natural environments.
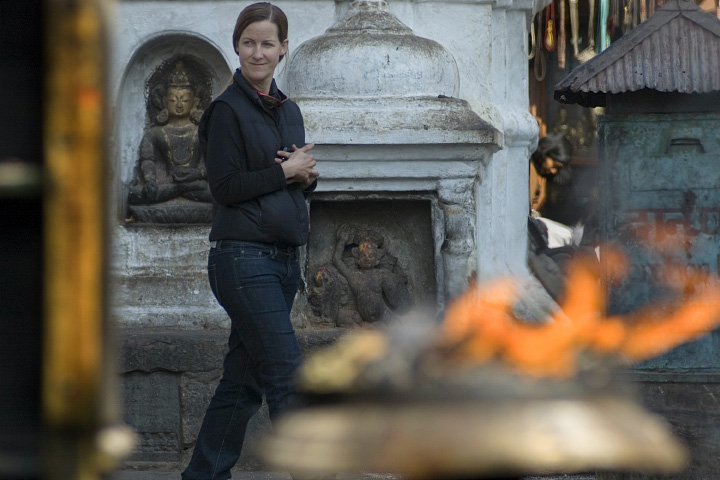
Kimberly Casey in Katmandu, Nepal, during an expedition to investigate the region’s glaciers. (Photograph ©2009 Jason Gulley.)
Casey is one of the first scientists to use satellite data to distinguish between the different types of debris—ranging from fine-grained aerosols, to bits of volcanic ash, to the large rocks and boulders—that end up on glaciers. After numerous expeditions to far-flung mountains, and years combing through satellite data at NASA’s Goddard Space Flight Center and the University of Oslo, she has something to show for it. Casey has produced satellite-derived maps of debris at key glaciers around the world. Her maps not only discriminate between dirty and clean ice; they describe the composition and source of the particulates and debris.
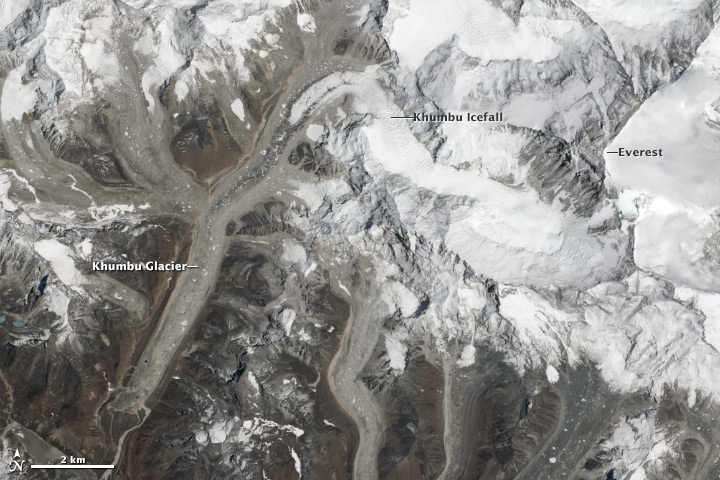
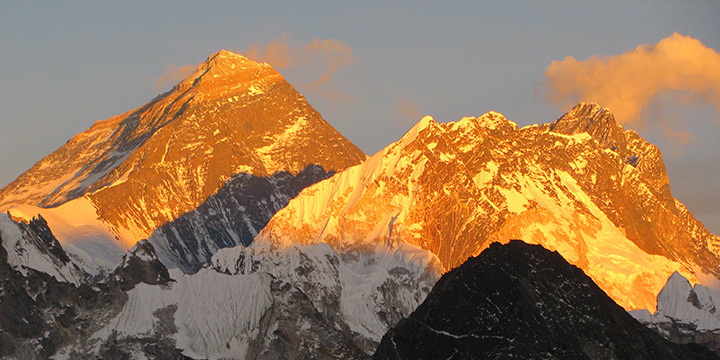
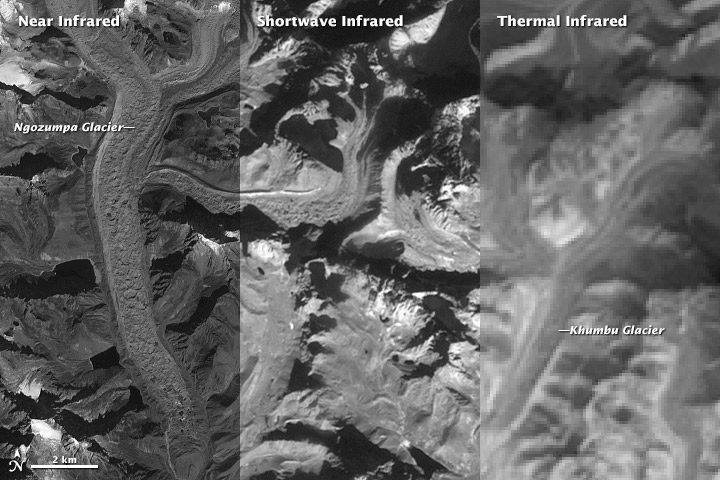
Many southern-facing Himalayan glaciers—including Khumbu Glacier on Mount Everest—have debris on their lower slopes. (NASA Landsat 8 image by Jesse Allen and Robert Simmon.)
“People have made rudimentary maps of ice debris before, but there has been very little work to map the geochemical composition of particulates on ice with satellites,” she said. The techniques she is pioneering could help answer long-standing, controversial questions about the impact of climate change on glaciers.
Glaciers are rivers of frozen ice, fed by snowfall at high-latitude or high-altitude locations that stay cool year round. Some glaciers slide off the edges of giant ice sheets in the Arctic and Antarctic. Others flow across high plateaus or down the slopes of mountains at middle latitude and even tropical locations. In all, about 10 percent of Earth’s land surface is covered with ice, divided into roughly 200,000 glaciers.
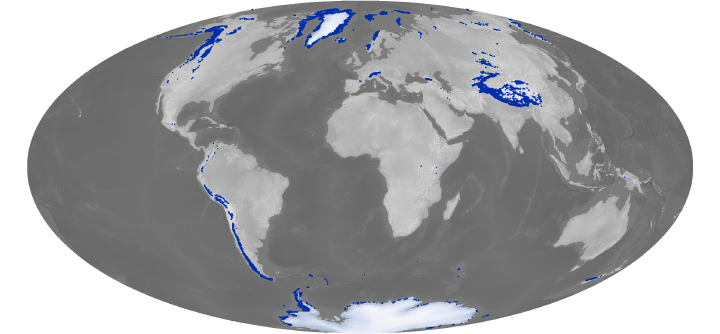
As part of the European Space Agency’s GlobGlacier project, Casey spent three years developing better techniques to tally and monitor all of this ice from space. Getting an exact count is more challenging than it sounds because researchers have to contend with cloud cover; debris that makes it difficult to detect ice boundaries; and glaciers that splinter into small pieces as they recede—pieces too small for satellites to distinguish.
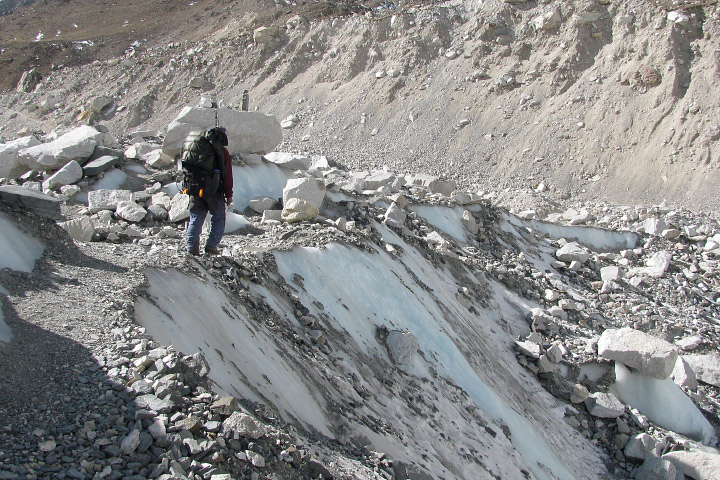
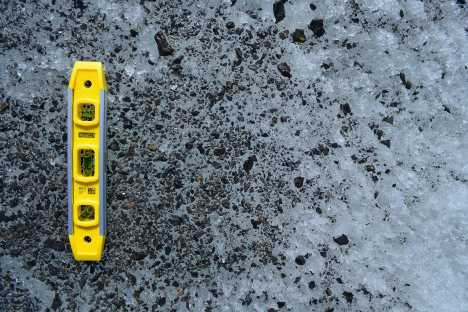
Debris on the surface of the Khumbu Glacier, near Everest Base Camp, Nepal. (Photograph ©2009 Kimberly Casey.)
There has been no shortage of receding glaciers to track. Satellite, aircraft, and ground-based data have documented widespread ice loss over the past few decades. An analysis by the World Glacier Monitoring Service found that 87 percent of the world’s 2,100 best-studied glacier fronts had retreated between 2000 and 2005.
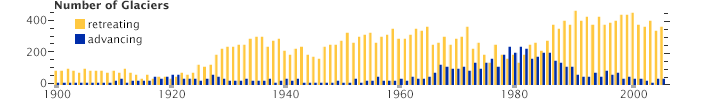
Currently, retreating glaciers watched by the World Glacier Monitoring Service outnumber advancing glaciers by about 8 to 1. (Graph adapted from Global Glacier Changes: facts and figures, United Nations Environment Programme.)
While the overall trend is toward retreat, there’s much scientists are still sorting out about how and when glaciers shrink or grow. In some basins, adjacent glaciers with the same temperature and precipitation conditions behave in radically different ways. In other basins, ice mass is being lost much more rapidly than expected. And glaciers in some areas, like those in the Karakoram Range of central Asia, have been gaining mass over the past few decades.
Some glaciologists suspect that thin layers of particulates and thick layers of debris are blanketing glaciers and may be contributing to the discrepancies. But there’s still no record of particulate or debris layers in most glacier inventories, so there’s no shortage of questions. Which types of particulates have the most influence? Which have the least? Which types coat which glaciers? How much does thickness or composition matter?
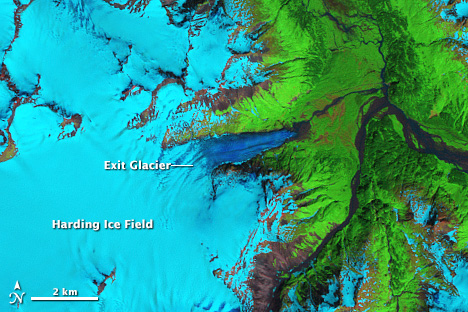
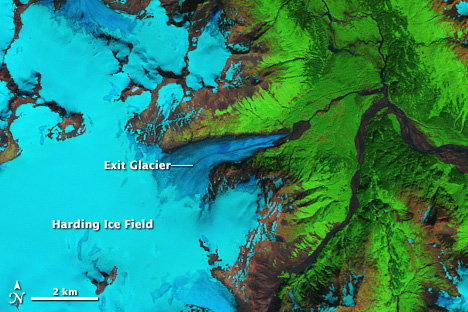
Debris along the margin of Alaska’s Exit Glacier makes it hard to determine how much the ice retreated from July 1986 to August 2009. Casey’s research is helping to refine techniques for differentiating rock-covered ice from the material left behind by a retreating glacier. (NASA images by Robert Simmon, using Landsat 5 data.)
“We need a much better understanding of all the particulates and debris types on the ice to understand how glaciers are responding to climate change,” Casey said. “And we simply do not have resources to send people out into the field to collect samples and measurements on all of these glaciers. That’s where satellites prove invaluable.”
One feature that Casey knew satellites could observe is fairly straightforward: the color and brightness of debris layers on glaciers. The color of the surface has important consequences. Just as dark-colored clothes will make you warmer on a sunny day because they absorb sunlight, dark-toned particulates—such as soot from industrial pollution and wildfires, or basaltic tephra from volcanoes—heat glacial surfaces. Dark debris causes snow and ice to melt faster because it absorbs sunlight more readily than lighter-colored materials like salt and silica-rich dust.
The reflectivity of a substance is known as its albedo. Bright surfaces have high albedos (close to 1), while dark surfaces have low albedos (close to 0). Pure snow generally has a visible albedo of .95, meaning it reflects more than 95 percent of the visible light that hits it. Desert sand reflects about 40 percent (albedo of 0.4), and pure soot reflects less than ten percent of incoming light (albedo 0.1)
Small amounts of soot can have a big impact on albedo. As far back as 1980, scientist Warren Wiscombe (then at the National Center for Atmospheric Research, today at NASA) showed that just a few parts per billion of soot could reduce the albedo of snow by up to 15 percent. Leading climatologists, including former NASA scientist James Hansen, have argued that sooty smoke and industrial pollution from South Asia is one of the main factors to cause Tibetan glaciers to recede so rapidly during the past decade.
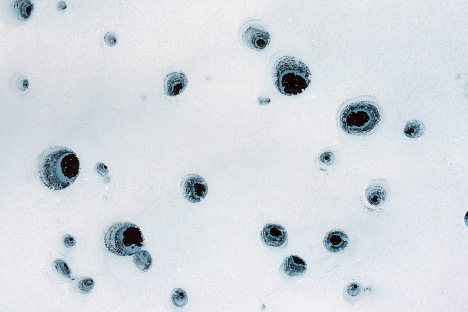
The composition of the debris on glacial surfaces also matters. Salts, for instance, dissolve into melt water on a glacier. Mixtures of soot, dust, pollen, and pulverized rock also make pockmarked, circular cavities in ice called cryoconites. These holes—which can grow to be meters deep—often fill with melt water that supports thriving colonies of cyanobacteria, fungi, and other microbes. The spread of these communities can even affect albedo as they spread over ice surfaces.
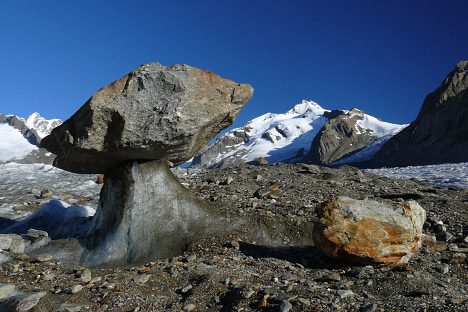
Some types of surface debris can hasten melting, forming pits in glacial ice through chemical melting or by absorbing heat from bright sunlight. Other types insulate the ice beneath. In some cases a large boulder will protect the ice beneath it as nearby ice melts, forming a glacier table. (Photographs ©2012 Kimberly Casey (top) and ©2010 Florian Mair (lower).)
Over time, cryoconite depressions can evolve into larger “suncups” and eventually into even larger, pipe-like depressions (moulins) that serve as conduits for liquid water. The water can cut deep into the ice, reaching the area where ice meets bedrock and changing how quickly the glacier flows.
The thickness of debris is also critical. While thin layers of dark particulates tend to heat the glacier surface and increase the rate of melting, thicker layers of debris can have the opposite effect. For instance, rocks, ash, and dirt from landslides or volcanic eruptions can behave like a blanket, insulating ice from changing air temperatures.
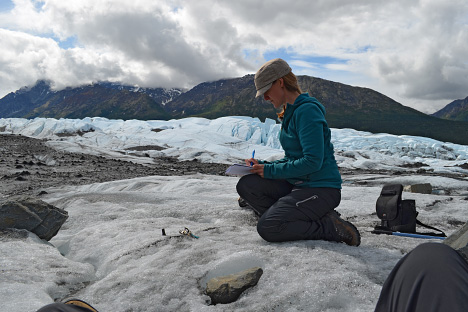
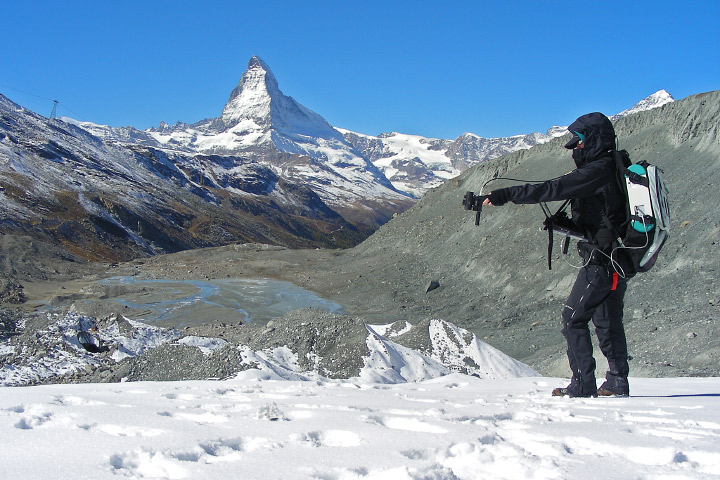
The obvious way to sort out which particulates are coating which glaciers—and how thick those layers are—is to put on some climbing boots and go up into the mountains and collect samples in person. Before she got involved in remote sensing research, Casey was trained as a geochemist, so she is comfortable peering at samples of particulates under a microscope. She is also comfortable climbing mountains. Over the last few years, she has done both.
She has traveled to remote alpine glaciers in the Rockies, the Himalayas, the European Alps, New Zealand’s “Southern Alps,” Peru, Norway, Tanzania, and even to the Arctic archipelago of Svalbard. In collecting samples from all of those sites, Casey’s goal was to get a first-hand, detailed look—both visual and geochemical—at the particulates on the ground so she could compare them with what she sees in satellite observations.
In Nepal, Casey hauled sampling equipment on a two-month expedition that brought her 5,500 meters (18,000 feet) up into the Himalayas to examine Khumbu and Ngozumpa glaciers. Snow from Mount Everest feeds Khumbu, the world’s highest glacier. Ngozumpa is perched on Cho Oyu, the sixth tallest mountain in the world. These long tongues of ice are covered with thick debris because the extreme terrain frequently sends avalanches and rockfalls tumbling down on them.
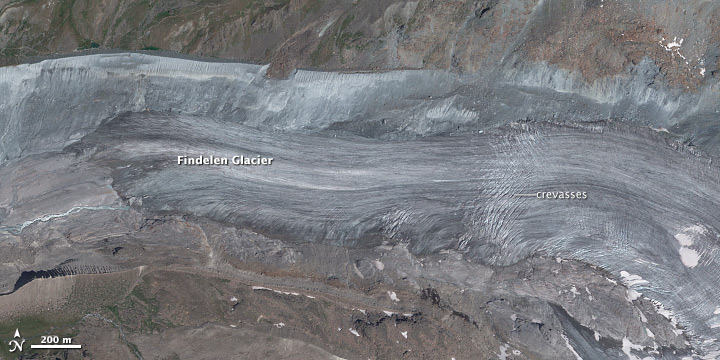
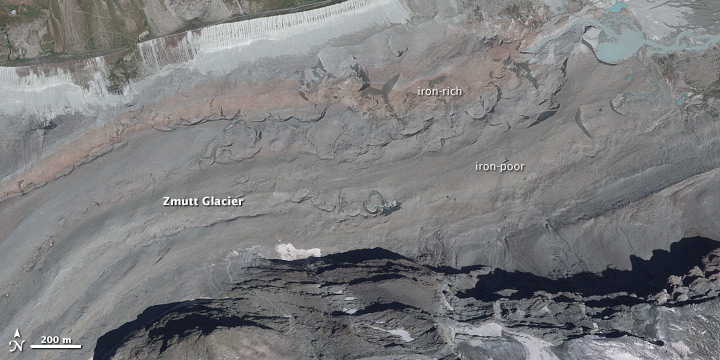
In New Zealand, she headed for Mount Ruapehu, the largest mountain on North Island. An active stratovolcano, Ruapehu frequently spits up ash clouds and sends muddy lahars sliding across the mountain’s eight small glaciers. In Switzerland, Casey sought the ice near the Matterhorn, where she sampled two valley glaciers—relatively clean Findelen and debris-covered Zmutt.
She has gone as far north as Spitsbergen, the largest island in the Norwegian archipelago of Svalbard. Just 1,000 kilometers (600 miles) from the North Pole, Spitsbergen is home to the northernmost permanent human settlement. It is also home to Grønfjordbreen and Aldegondabreen, two small glaciers on the western coast that receive heavy loads of salt from the sea and extensive coal particulates from nearby mines.
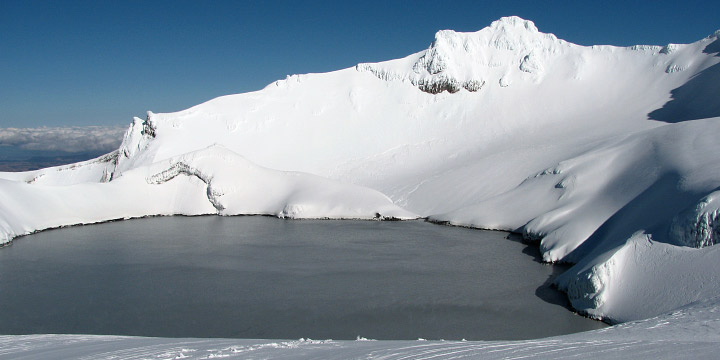
A warm, sulfurous lake lies within the snow-covered summit crater of Mount Ruapehu, New Zealand. (Photograph ©2009 Kimberly Casey.)
Though her goal was to collect data, Casey also found herself transfixed by the beauty of these rarely-seen landscapes. She took thousands of photographs, and those studies in ice have become a source of inspiration for her art. “In New Zealand, in particular, the combination of the volcanic emissions and the sulfur gas was surreal,” she said. “There’s a warm crater lake on Ruapehu with so much sulfur gas bubbling up that the nearby ice had an ethereal yellow sheen. It was like being on another planet.”
When Casey came up with the idea of using satellites to map glacier debris as part of her doctoral studies in Norway, colleagues and mentors told her it was a fool’s errand. Satellites had been used to map the geochemistry of particulates in arid environments, but nobody had tried to make such observations in icy environments.
She was told there would be more “noise” than signal; that the resolution of existing instruments wasn’t good enough; that it simply was not possible. “But I had worked with satellite data before,” she said, “and I knew how much untapped spectral information many sensors were collecting.”
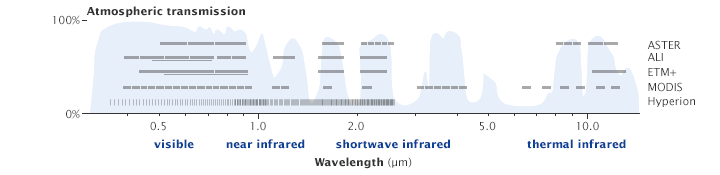
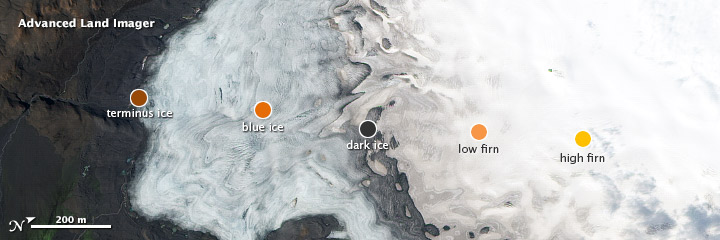
By “spectral information,” Casey is referring to information embedded in specific parts, or bands, of the electromagnetic spectrum. While the human eye perceives only a narrow portion of the spectrum, satellite instruments can sense a much broader range of wavelengths. Many sensors are tuned to be sensitive to types of energy—such as the infrared—that are invisible to human eyes.
The Advanced Spaceborne Thermal Emission and Reflection Radiometer (ASTER) instrument on Terra—built by Japan’s Ministry of Economy, Trade, and Industry—has six bands in the shortwave infrared (just beyond red light at 1.0 to 2.5 microns) and five in the thermal infrared (3 to 12 microns). The Enhanced Thematic Mapper Plus (ETM+) and Operational Land Imager (OLI) on Landsats 7 and 8 also have bands in the shortwave and thermal infrared bands.
These wavelengths are critical because each different type of particulate—be it ash, dust, or soot—leaves unique “spectral fingerprints” that satellite sensors can measure. By searching for the right clues in the right bands, Casey was able to get a glimpse into the geochemistry of the particles with a sensor that was hundreds of kilometers away.
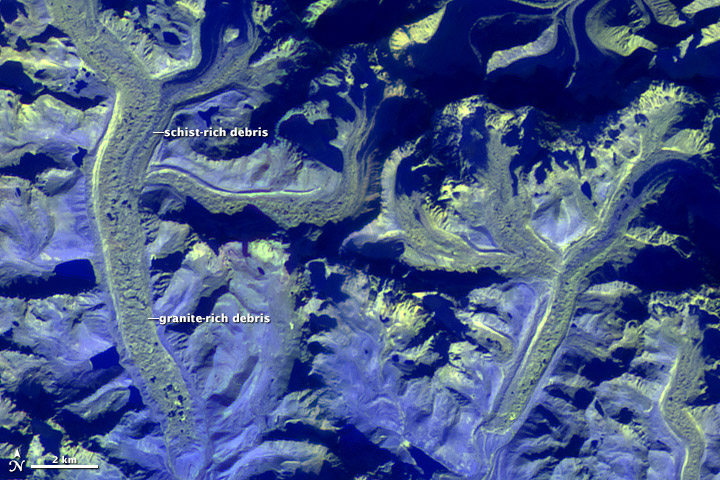
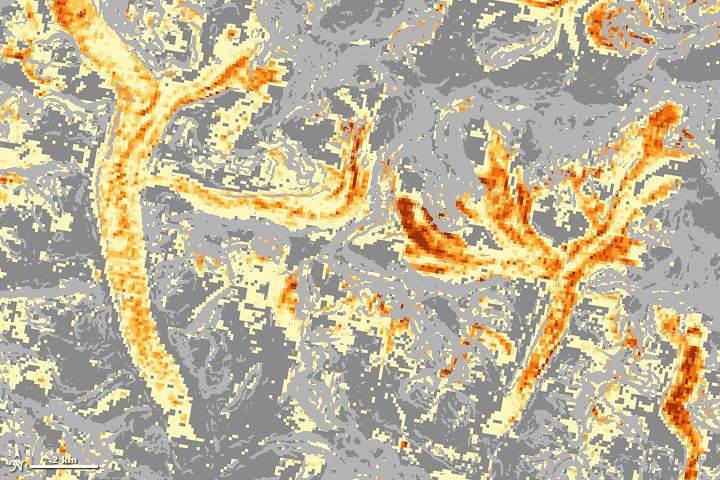
Using spectral information from outside the range of visible light, Casey is able to map different types of debris, like granite-rich vs. schist-rich (top) or by silica content (lower). (Adapted from Casey et al, 2012., using ASTER data.)
By analyzing ASTER data from the visible to thermal infrared, for instance, she was able to discriminate between patches of dark red, iron-rich debris and lighter colored iron-poor debris on Switzerland’s Zmutt glacier. Looking at the tongue of Khumbu glacier in Nepal, she used ASTER to distinguish between dark, schist-rich debris and a lighter patch of granite-rich debris. Schist is a metamorphic rock, while granite is igneous.
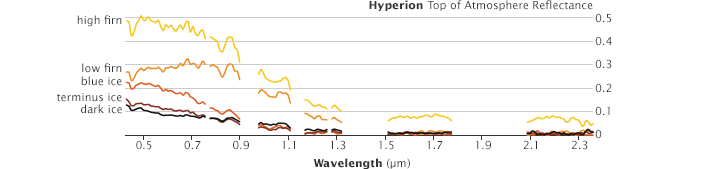
For a few glaciers, Casey was able to use “hyperspectral” data collected by Hyperion, an instrument on NASA’s Earth Observing-1 (EO-1) satellite that collects information in more than 200 discrete spectral wavelengths and offers a flood of detail. (Most other satellite spectrometers measure a few dozen at most.) Remote sensing scientists say it’s like standing in a home improvement store, asking for white paint, and having the clerk ask: “Do you want off-white, colonial white, antique white, or eggshell white?”
But Hyperion does have its drawbacks. It produces so much data that it can be difficult to interpret. And while some other instruments can see a large swath of Earth’s surface at once, Hyperion has a small field of view.
Still, the ability to detect electromagnetic radiation in so many discrete spectral bands meant Casey could get a very detailed view of the geochemistry of materials on the glaciers it flew over. She found, for instance, valuable observations from Lhotse Shar and Imja glaciers in Nepal, Whakapapa and Mangatoetoenui glaciers in New Zealand, and the Hofsjökull Ice Cap in Iceland.
“It has been incredibly satisfying to go into the field and collect spectral and physical samples, analyze debris samples for geochemical composition, and confirm geochemical results for what I’ve described with the satellite data,” said Casey. “By collecting field samples in several different glacial environments, I think I’ve been able to prove that satellites can actually do this kind of work.”
Her next step is to develop methods to automate the debris-mapping process. So far, she has analyzed satellite images, one by one, with her own eyes. But she hopes to develop algorithms that get computers to do more of the work. She also plans to start working with colleagues at NASA Goddard to characterize particulate matter in the atmosphere immediately above glaciers, instead of focusing exclusively on particulates directly on the ice surface.
All of this should bring Casey closer to producing the global maps of glacial particulates that scientists need to start asking broader questions. Where are rates of particulate matter changing and why? What do those changes mean for the health of glaciers? And as the world grows warmer, how will the circulation of dust storms, wildfire smoke, salt spray, and other particulates affect the ice?
Plenty of challenges remain for Casey. ASTER, the most useful instrument for this type of mapping, is 13 years old and some of its most informative mid-infrared bands stopped working in 2008. NASA does not plan to launch a replacement, but the European Space Agency is planning to launch a satellite in 2014—Sentinel 2—that will have similar spectral capabilities. And NASA is in the early stages of developing the Hyperspectral Infrared Imager (HyspIRI), which would carry a sensor similar to Hyperion.
“The glaciers aren’t going to stop changing,” said Casey. “We need to continue looking at them with satellites so we can understand why.”
