|
The idea seemed simple enough: the more carbon dioxide that people pumped into the atmosphere by burning fossil fuels, the more the oceans would absorb. The ocean would continue to soak up more and more carbon dioxide until global warming heated the ocean enough to slow down ocean circulation. Water trapped at the surface would become saturated, at which point, the ocean would slow its carbon uptake. To oceanographers of 30 years ago, the question was less, how will human emissions change the ocean carbon cycle, and more, is the ocean carbon cycle changing yet? |
|||
 | |||
|
The question matters because if the ocean starts to take up less carbon because of global warming, more is left in the atmosphere where it can contribute to additional warming. Scientists wanted to understand how the ocean carbon cycle might change so that they could make more accurate predictions about global warming. Thus motivated, oceanographers began a series of research cruises, trolling across the Pacific from Japan to California, from Alaska to Hawaii, and through the North Atlantic from Europe to North America. On shore, others developed computer models. |
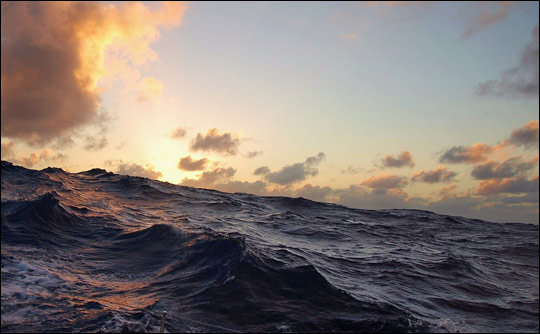
One of the largest unknowns in our understanding of the greenhouse effect is the role of the oceans as a carbon sink. Much of the carbon dioxide released into the atmosphere by the burning of fossil fuels is soaked up by the oceans, but changes in the climate are altering this absorption in surprising ways. (Photograph ©2007 *Fede*.) | ||
 | |||
|
After 30 years of research, the question itself hasn’t changed, but the reasoning behind it couldn’t be more different. Oceanographers started out wanting to know if the ocean was keeping up with the amount of carbon dioxide people are putting into the atmosphere. Instead, they found that people aren’t the only players changing the ocean carbon cycle. Over decades, natural cycles in weather and ocean currents alter the rate at which the ocean soaks up and vents carbon dioxide. What’s more, scientists are beginning to find evidence that human-induced changes in the atmosphere also change the rate at which the ocean takes up carbon. In other words, it turns out that the world is not a simple place. The Measured OceanThe group surrounds a circular cluster of instruments and 36 three-foot-tall PVC (plastic) bottles, taking turns extracting sea water from the bottles, assembly-line style. It is a deliberate, well-ordered procedure. The glass sample bottles set aside for oxygen samples are filled first, followed by the massive syringe meant for chlorofluorocarbon (freon) samples, and so on, until 10 to 15 different samples have come out of each bottle. Everyone has a task and a place. It’s a social event, a break from the lonely hours each will spend in his or her lab analyzing the samples before the next batch is hauled out of the ocean. It might even be fun. Except that it’s late winter. In the North Pacific. And they are on the deck of a ship, looking at the same faces that they’ve seen day after day for four weeks or more, and they’ll be repeating this procedure again in another 30 nautical miles. |
For more than 30 years, research ships have cruised the world’s oceans, measuring carbon dioxide concentrations, ocean temperatures, winds, and other properties. The map shows the paths of research cruises conducted as part of the World Climate Research Programme’s Climate Variability and Predictability project. Cruise measurements—along with those from buoys, drifting floats, orbiting satellites, and land-based weather stations—are beginning to reveal long-term trends to ocean researchers. (Map by Robert Simmon, based on data from Dana Greeley, NOAA.) | ||
 | |||
|
“It’s pretty brutal,” says Richard Feely, with the air of a veteran who thoroughly enjoys his work. An oceanographer who studies the ocean carbon cycle at the National Oceanic and Atmospheric Administration’s Pacific Marine Environmental Laboratory, he’s been at this sort of thing for almost forty years. Feely is one of a community of oceanographers who have been monitoring Earth’s oceans for decades, trying to figure out how much human-released carbon dioxide the ocean has been soaking up. For eons, the world’s oceans have been sucking carbon dioxide out of the atmosphere and releasing it again in a steady inhale and exhale. The ocean takes up carbon dioxide through photosynthesis by plant-like organisms (phytoplankton), as well as by simple chemistry: carbon dioxide dissolves in water. It reacts with seawater, creating carbonic acid. Carbonic acid releases hydrogen ions, which combine with carbonate in seawater to form bicarbonate, a form of carbon that doesn’t escape the ocean easily. |
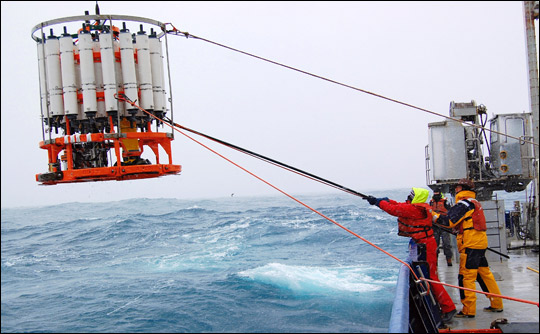
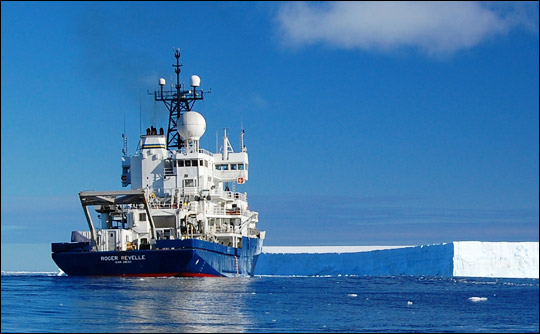
Crew members aboard the R/V Roger Revelle retrieve a CTD rosette from the frigid waters of the Southern Ocean. As the device is lowered into the ocean, electronic instruments measure salinity, temperature, and depth. Each of the white bottles collects seawater at different depths for detailed analysis. (Photograph ©2008 Brett longworth.) | ||
 |
As we burn fossil fuels and atmospheric carbon dioxide levels go up, the ocean absorbs more carbon dioxide to stay in balance. But this absorption has a price: these reactions lower the water’s pH, meaning it’s more acidic. And the ocean has its limits. As temperatures rise, carbon dioxide leaks out of the ocean like a glass of root beer going flat on a warm day. Carbonate gets used up and has to be re-stocked by upwelling of deeper waters, which are rich in carbonate dissolved from limestone and other rocks. In the center of the ocean, wind-driven currents bring cool waters and fresh carbonate to the surface. The new water takes up yet more carbon to match the atmosphere, while the old water carries the carbon it has captured into the ocean. |
The concentration of carbon dioxide (CO2) in ocean water (y axis) depends on the amount of CO2 in the atmosphere (shaded curves) and the temperature of the water (x axis). This simplified graph shows that as atmospheric CO2 increases from pre-industrial levels (blue) to double (2X) the pre-industrial amounts (light green), the ocean CO2 concentration increases as well. However, as water temperature increases, its ability dissolve CO2 decreases. Global warming is expected to reduce the ocean’s ability to absorb CO2, leaving more in the atmosphere…which will lead to even higher temperatures. (Graph by Robert Simmon.) | |
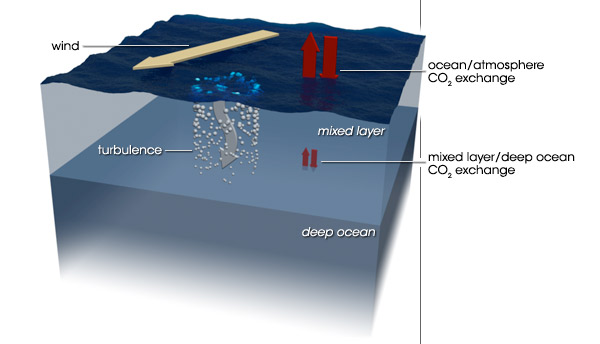
In the short term, the ocean absorbs atmospheric carbon dioxide into the mixed layer, a thin layer of water with nearly uniform temperature, salinity, and dissolved gases. Wind-driven turbulence maintains the mixed layer by stirring the water near the ocean’s surface. Over the long term, carbon dioxide slowly enters the deep ocean at the bottom of the mixed layer as well in in regions near the poles where cold, salty water sinks to the ocean depths. (NASA illustration by Robert Simmon.) | |||
|
The warmer the surface water becomes, the harder it is for winds to mix the surface layers with the deeper layers. The ocean settles into layers, or stratifies. Without an infusion of fresh carbonate-rich water from below, the surface water saturates with carbon dioxide. The stagnant water also supports fewer phytoplankton, and carbon dioxide uptake from photosynthesis slows. In short, stratification cuts down the amount of carbon the ocean can take up. |
|||
Defying ExpectationsTo try to understand the ocean’s carbon limits, Feely and the rest of the oceanography community measure dissolved carbon and the ocean’s pH. They probe its temperature, alkalinity, salinity, and record the presence of tracers like chlorofluorocarbons or helium to find out when the water was last exposed to the atmosphere. By the end of a typical cruise, they will have collected 50,000 or more measurements. And then they go out the next year to repeat it all again, and they have done this for more than three decades. |
|||
 | |||
|
“When we started in the 70s and 80s, we had this concept: we’ll measure [carbon dioxide concentrations in the ocean] 10 years later, and we’ll just see the anthropogenic input,” says Feely. “We had very simplistic ideas that the anthropogenic changes would be the only changes we would see,” he adds a little ruefully. Feely and his colleagues saw changes, but they weren’t at all the changes they expected. Carbon concentrations in the ocean did rise as atmospheric carbon dioxide skyrocketed, but in 2006, Feely and several colleagues announced that the equatorial Pacific seemed to be venting more carbon dioxide to the atmosphere between 1997 and 2004 than it had in previous years. And in 2007, Ute Schuster and Andrew Watson, oceanographers from the University of East Anglia, reported that amount of carbon that the North Atlantic Ocean soaked up decreased by a factor of two between 1994 and 2005. The ocean, or parts of it, seemed to be taking up less, not more, carbon. Had the ocean already stratified, slowing the rate at which it soaked up carbon? Schuster and Watson believed they saw stratification at work in the North Atlantic, but the drop in the amount of carbon being taken up was too large for global warming to be acting alone. During the decade Schuster and Watson made their observations, a large-scale weather pattern, called the North Atlantic Oscillation, shifted. Like El Niño in the Pacific, the North Atlantic Oscillation (NAO) changes weather on a large scale. In the early 1990s, says Watson, the North Atlantic Oscillation brought stronger and more frequent winds to the northern regions of the North Atlantic during the winter. The winds stirred the ocean, tucking carbon-dioxide-laden surface water down and pulling unsaturated water to the surface, in effect increasing the rate at which the North Atlantic took up carbon. By 2000, the North Atlantic Oscillation shifted, calming winds and allowing warmer waters to expand north. These two changes increased stratification in the North Atlantic and slowed the carbon uptake between 1994 and 2005, says Watson. |
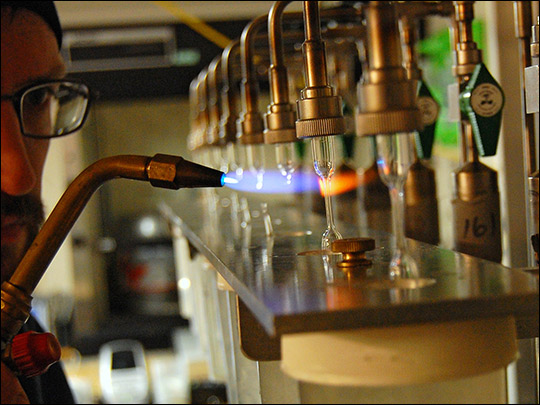
A scientist uses a torch to seal glass ampoules containing dissolved gases extracted from seawater. Tens of thousands of samples were collected during the Climate Variability and Predictability cruises. Scientists were surprised when decades of sampling revealed a complex relationship between man-made carbon dioxide emissions, cyclical changes in climate, and the oceanic carbon cycle. (Photograph ©2008 Brett longworth.) | ||
| |||
|
In the Pacific, Feely tracked the increased venting at the equator to a shift in another natural pattern. The Pacific Decadal Oscillation is a decades-long climate pattern that alternately warms and cools the ocean. “When the Pacific Decadal Oscillation shifts into its cold phase, you get stronger winds and stronger upwelling,” says Feely. |
In the early 1990s, the North Atlantic Oscillation was strongly positive (green bars) during winter. In the mid-90s, the climate pattern became more variable, but overall, was weakly negative. Lower winds and higher temperatures in the North Atlantic slowed carbon uptake. (Graph by Robert Simmon, based on NCAR data.) | ||
| |||
|
The ocean does not take up carbon uniformly. It breathes, inhaling and exhaling carbon dioxide. In addition to the wind-driven currents that gently stir the center of ocean basins (the waters that are most limited by stratification), the ocean’s natural, large-scale circulation drags deep water to the surface here and there. Having collected carbon over hundreds of years, this deep upwelling water vents carbon dioxide to the atmosphere like smoke escaping through a chimney. The stronger upwelling brought by the cold phase of the Pacific Decadal Oscillation apparently enhanced the size of the chimney and let more carbon escape to the atmosphere. |
In the equatorial Pacific, carbon dioxide venting increased between 1997 and 2004. This coincided with a shift in the Pacific Decadal Oscillation (PDO) from a warm phase (positive) to a cool phase (negative), during which winds and upwelling of deep water are stronger. The graph shows the values of the PDO index as 1-year averages (line) and five-year averages (shaded). (Graph by Robert Simmon, based on JIASO data.) | ||
 | |||
|
After 30 years of measurements, the ocean carbon community is realizing that tracking human-induced changes in the ocean is not as easy as they thought it would be. It wasn’t a mere matter of measuring changes in carbon concentrations in the ocean over time because the natural carbon cycle in the ocean turned out to be a lot more variable than they imagined. “We discovered that natural processes play such an important role that the signals they generate can be as large as or larger than the anthropogenic signal,” says Feely. “Now we are trying to address how these decadal changes affect the uptake of carbon. Once we account for these processes, we can remove them from the data set and calculate the anthropogenic carbon dioxide as the residual.” But to track the increasingly complicated carbon balance sheet, the ocean community needed models, mathematical simulations of the natural world. |
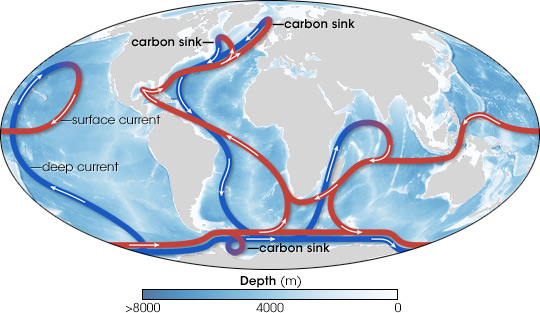
The global oceans are connected by deep currents (blue lines) and surface currents (red). Carbon from the atmosphere enters the ocean depths in areas of deep water formation in the North Atlantic and offshore of the Antarctic Peninsula. Where deep currents rise towards the surface, they can release “fossil” carbon dioxide stored centuries ago. (Map by Robert Simmon, adapted from the IPCC 2001 and Rahmstorf 2002.) | ||
The Modeled OceanRather than huddling over bottles of water on a ship in the middle of winter, Corinne Le Quéré huddles in front of a computer screen in her office at the University of East Anglia. “I have an easy life compared to the people who do observations,” she notes. “I’m a modeler. I stay in my office all day.” With the click of a mouse, Le Quéré gathers real-world observations into a computer program that simulates ocean processes. The model helps scientists put together measurements like Feely’s—snapshots of the ocean at specific places and times—to see how individual processes come together to create the conditions they observed. In 2007, Le Quéré announced that her model helped her uncover the first evidence that human activity is changing the ocean carbon sink. |
|||
 | |||
|
Le Quéré and a number of colleagues were studying a natural weather cycle, the Antarctic Circumpolar Wave, which circles Antarctica in the Southern Ocean. “We were trying to see if we could detect which direction the carbon dioxide flux changed when the circumpolar wave passed through,” says Le Quéré. In other words, did the phenomenon cause the ocean to take up more or less carbon dioxide? Unlike Feely and other observational oceanographers who had been trying to measure the human impact on the ocean carbon cycle for decades, Le Quéré simply wanted to understand how natural processes could change the way the Southern Ocean takes carbon from the atmosphere. The problem, Le Quéré found, was there was not enough ocean data to simulate changes in the ocean as the Antarctic Circumpolar Wave changed. “There’s not very much data in the Southern Ocean because people don’t want to go there in the winter. There’s too much wind. But you need winter data to get changes in the carbon sink,” says Le Quéré. “I can complain that there are no data in the winter, but there’s no way I would go there myself,” she adds with a laugh. Instead, Le Quéré inferred ocean carbon dioxide levels based on atmospheric measurements. Scattered across the southern hemisphere, a number of isolated weather stations track concentrations of carbon dioxide in the atmosphere. Many are automated, says Le Quéré, but in some cases, hardy samplers trek outside at the same time every day to pump a sample of atmosphere into a flask, most of which are shipped to the National Oceanic and Atmospheric Administration’s Earth System Research Laboratory in Boulder, Colorado. For Le Quéré, the more remote stations—in places like the South Pole, Palmer Station on the tip of the Antarctic Peninsula, Amsterdam Island in the south Indian Ocean, and Ascension Island in the South Atlantic—provided key measurements. |
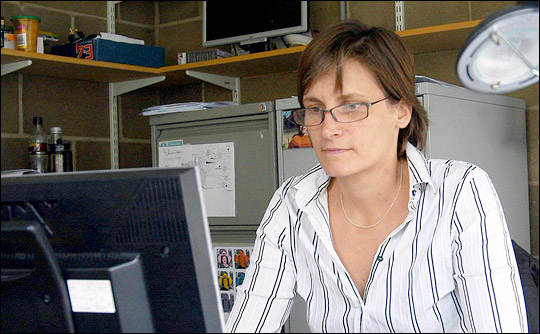
Corinne Le Quéré studies the carbon cycle through computer simulations that incorporate direct observations. (Photograph ©2008 Sheila Davies, University of East Anglia.) | ||
 | |||
|
In these remote places, the biggest thing changing atmospheric carbon dioxide levels is the ocean. The plants whose seasonal cycles dominate atmospheric carbon dioxide concentrations in other parts of the world, simply don’t exist in such places. “If there is one place in the world where you can [measure changes in the ocean carbon sink with atmospheric measurements], it is over the Southern Ocean,” says Le Quéré. “It is the place where you have the least contaminated air, so to speak.” When Le Quéré plugged atmospheric measurements from the Southern Ocean between 1981 and 2004 into her model, she was startled by the result—something far more interesting than the Antarctic Circumpolar Wave. “The Southern Ocean carbon sink has not changed at all in 25 years. That’s unexpected because carbon dioxide is increasing so fast in the atmosphere that you would expect the sink to increase as well,” says Le Quéré. But it hadn’t. Instead, the Southern Ocean held steady, while atmospheric carbon dioxide concentrations climbed. Why? |
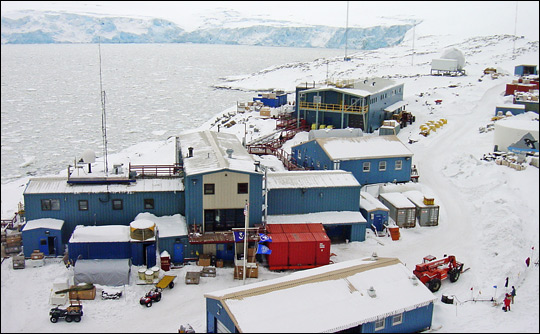
Continuous measurements of the atmosphere are obtained at cold and remote observatories on the shores of the Southern Ocean, such as Palmer Station on the Antarctic Peninsula. These atmospheric data complement the direct measurements of ocean water made during research cruises. (Photograph courtesy Jeffrey Kietzmann, National Science Foundation.) | ||

|
|
Le Quéré expected to see a steady increase in the amount of carbon dioxide absorbed by the Southern Ocean between 1981 and 2004 (blue line). Instead, weather station measurements (red line) suggested year-to-year variability, but no long-term increase over time. (Graph by Corrine Le Quéré, University of East Anglia.) | |
Humanity’s Unexpected ImpactThe wind measurements that Le Quéré had entered into her model held the key. Since 1981, winds in the Southern Ocean increased, and Le Quéré believes that the ozone hole and global warming are to blame. “Ozone naturally warms the upper atmosphere because it captures the radiation from the Sun and re-emits it there,” says Le Quéré. “If you deplete ozone, you get a very large cooling in the upper atmosphere.” The huge temperature difference between the ozone hole and the rest of the stratosphere causes strong winds around Antarctica. Uneven warming in different parts of the southern hemisphere from recent global warming also created a temperature difference that strengthened the winds. The stronger winds enhance deep water upwelling, which allows carbon to vent into the atmosphere from carbon-rich deep water. In essence, while the ocean may be taking up more anthropogenic carbon to keep pace with levels in the atmosphere, it’s also venting more carbon than it did in the past, and that changes the size of the overall sink. |
|||
 | |||
|
Like Feely saw in the equatorial Pacific, stronger winds made the Southern Ocean vent more carbon dioxide in areas where deep water upwelled to the surface. This idea, that upwelling water releases carbon dioxide, ran counter to what oceanographers had believed about stratification for decades. “When I started, everybody said if the ocean stratifies, then it will absorb less anthropogenic CO2. But really now, it’s not so clear,” says Le Quéré. If global warming causes upwelling areas like the high latitudes or the equatorial Pacific to stratify, then the natural carbon dioxide that is normally released during venting may just stay in the deep ocean. Stratification might wind up having competing effects on the overall carbon cycle, with saturation slowing carbon dioxide uptake in surface waters, but also suppressing venting. The other assumption that Le Quéré’s work rattled was the idea that the only way people would change the ocean carbon sink is through increased concentrations of atmospheric carbon dioxide. “At the beginning, we thought the important aspect was the increase in atmospheric CO2,” says Le Quéré. “And now, I think the changes in ocean physics [mixing] are very important as well. I wouldn’t be surprised if the changes in marine ecosystems become equally important, but we just haven’t seen this yet.” “The link between the destruction of the ozone layer, the changing wind patterns, and the impact on the carbon cycle is the thing that makes Le Quéré’s paper unique,” says Feely. “It links back to man-made impacts on the climate.” The idea that the man-made ozone hole and global warming have changed the Southern Ocean carbon sink is “disturbing on the one hand, but extremely interesting also,” says Jorge Sarmiento, an ocean modeler and Le Quéré’s former mentor at Princeton University. Not surprisingly, Le Quéré’s ground-breaking work has been controversial. Two other groups have challenged her study in letters to Science, where her work was published, but Le Quéré is standing by her results. The problem is, the method of deriving the size of the ocean sink from atmospheric carbon, not ocean carbon, is uncertain. And like all models, Le Quéré’s model has uncertainties of its own. “I think it’s possible that the Southern Ocean sink is slowing down,” says Sarmiento, “[Le Quéré] did a super job of bringing in all kinds of constraints on the model, but all of them have huge uncertainties. I’m still holding off.” Feely agrees. “In this case, modelers are leaping ahead of the observationalists. What we as oceanographers want to do is make sure that there is a sufficient amount of oceanographic data to substantiate that. You need 30 years of data before you can say anything, and that’s an incredible feat in itself.” |
The key to understanding the stability of the Southern Ocean carbon sink turned out to be winds. Since the early 1980s, winds circling Antarctica steadily increased, driven by both global warming and changes in the upper atmosphere caused by the ozone hole. (Graph by Robert Simmon, based on National Centers for Environmental Prediction (NCEP) data.) | ||
 | |||
|
And so the question remains: How is the ocean carbon sink changing? As scientists try to answer the question today, they have more tools available to them, including NASA satellites that measure the productivity of ocean plant life, winds that stir the water’s surface, and global temperature patterns that reveal ocean circulation. And in late 2008, NASA will launch the Orbiting Carbon Observatory, which will track the abundance and distribution of carbon in the atmosphere. The technology has evolved over the past decade as scientists realized that to understand the ocean carbon cycle, they are going to have to look for the human fingerprint in ocean circulation and biology, not just in ocean chemistry. “When I started about 15 years ago, it was assumed that the circulation of the ocean did not change. The only thing we ever thought about was carbon dioxide increasing in the atmosphere,” says Le Quéré. “Now we have a much broader view of what is happening. I think very few people accept the steady state hypothesis anymore. That’s finished.” |
Like much research, Feely and Le Quéré’s work creates almost as many questions as answers: What other climate cycles affect the oceanic carbon sink? Will the Southern Ocean return to normal as Antarctic ozone recovers? Will the increasing severity of global warming finally cause much of the ocean surface to stratify? In time—with continuing study—these questions will be answered, to be replaced with new ones. (Photograph ©2008 Brett Longworth.) | ||
|
