For decades, most estimates of Earth’s total river water were refinements of a 1974 United Nations figure. Better estimates have been hard to come by due to a lack of observations of the world’s rivers, particularly those far from human populations. Now, using a novel approach, NASA scientists have made new estimates of how much water courses through Earth’s rivers, the rates at which it flows into the ocean, and how much both figures have fluctuated over time. Such information is crucial for understanding the planet’s water cycle and managing its freshwater supplies.
To achieve a global picture of how much water is held by Earth’s rivers, scientists at NASA’s Jet Propulsion Laboratory (JPL) combined stream-gauge measurements with computer models of about 3 million river segments around the world. The research was led by Elyssa Collins, who conducted the analysis as a JPL intern and doctoral student at North Carolina State University, and was published in Nature Geoscience.
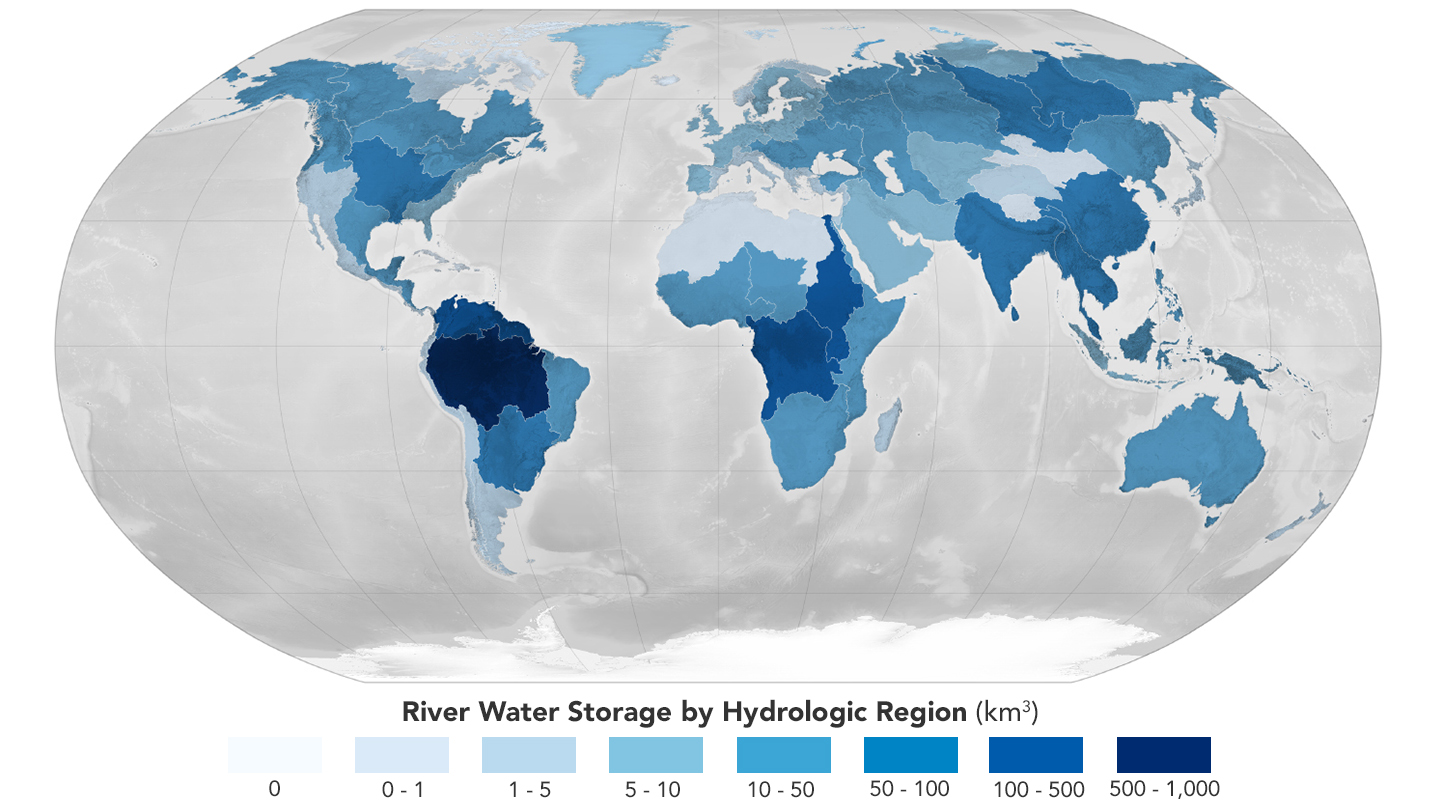
The scientists estimated that the total volume of water in Earth’s rivers on average from 1980 to 2009 was 2,246 cubic kilometers (539 cubic miles). That’s equivalent to half of Lake Michigan’s water and about 0.006 percent of all fresh water, which itself is 2.5 percent of the global volume. Despite their small proportion of all the planet’s water, rivers have been vital to humans since the earliest civilizations.
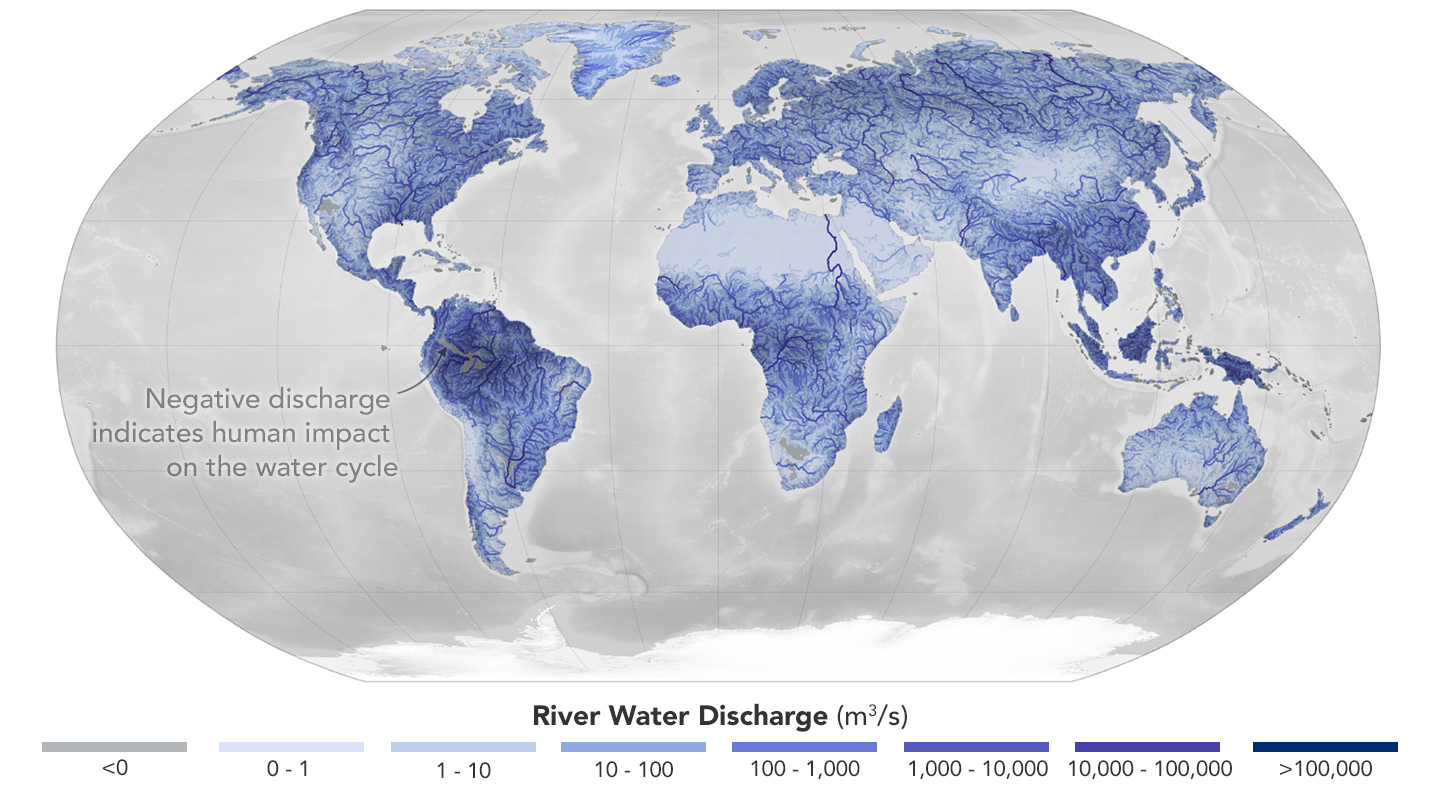
The map at the top of this page shows the volume of water stored by hydrologic region. The researchers estimated that the Amazon basin (darkest blue) contains about 38 percent of the world’s river water, the most of any hydrologic region evaluated. The same basin also discharges the most water to the ocean (second map): 6,789 cubic kilometers (1,629 cubic miles) per year. That’s 18 percent of the global discharge to the ocean, which averaged 37,411 cubic kilometers (8,975 cubic miles) per year from 1980 to 2009.
Although it’s not possible for a river to have negative discharge—the study’s approach does not allow for upstream flow—for the sake of accounting, it is possible for less water to come out of some river segments than went in. That’s what the researchers found for parts of the Colorado, Amazon, and Orange river basins, as well as the Murray-Darling basin in southeastern Australia. These negative flows mostly indicate intense human water use.
“These are locations,” Collins said, “where we’re seeing fingerprints of water management.”
NASA Earth Observatory images by Lauren Dauphin, using data from Collins, E.L., et al. (2024). Text was adapted from materials first published on April 24, 2024, by Andrew Wang/JPL.